

Gaspard LEZIN
Marginal Revenue Calculator: Boost Your 2026 Business
Calculate marginal revenue with ease! Get clear formulas, examples, and use our free marginal revenue calculator to make smarter 2026 business decisions.
You're staring at a pricing change that looked smart in a meeting and messy in your dashboard. Maybe sales wants a discount to close more deals, or you're deciding whether one more subscription seat should be cheaper than the first. A marginal revenue calculator helps you test the actual effect of that move before you bake it into your pricing.
Table of Contents
What Is Marginal Revenue and Why Does It Matter
A founder usually feels this number before they name it. You test a lower price, sales move up, and then the critical question hits, did the extra volume genuinely earn more revenue, or did the discount just make each sale less valuable?
Marginal revenue is the change in total revenue from one more unit sold. Finance references describe it that way conceptually, and that definition is the one that matters in practice, because it tells you whether growth is adding value or just adding activity. For a broader way to connect pricing, demand, and business modeling, the piece on business analysis with econometrics is a useful complement.
Why founders should care
Total revenue can look healthy while the incremental decision is weak. A company can grow top-line sales and still make a bad pricing move if the extra unit comes at a steep discount or triggers lower prices for the rest of the order.
That's why marginal revenue is useful in day-to-day pricing work. It helps you decide whether to lower a price, add a tier, offer a bundle, or push one more sale through a campaign. In simple terms, it is a decision metric, not an accounting trophy.
Practical rule: If a pricing change increases volume but weakens the revenue gained from the next sale, the marginal view is the one to trust.
The calculator matters most when the business is selling something that doesn't behave like a single physical unit. Subscriptions, seat-based SaaS, bundles, and promotional pricing all make the “one more unit” assumption less obvious than a textbook example suggests. If your sales motion is digital, recurring, or tiered, marginal revenue tells you where the price-volume trade-off starts to bite.
The Core Formulas for Calculating Marginal Revenue
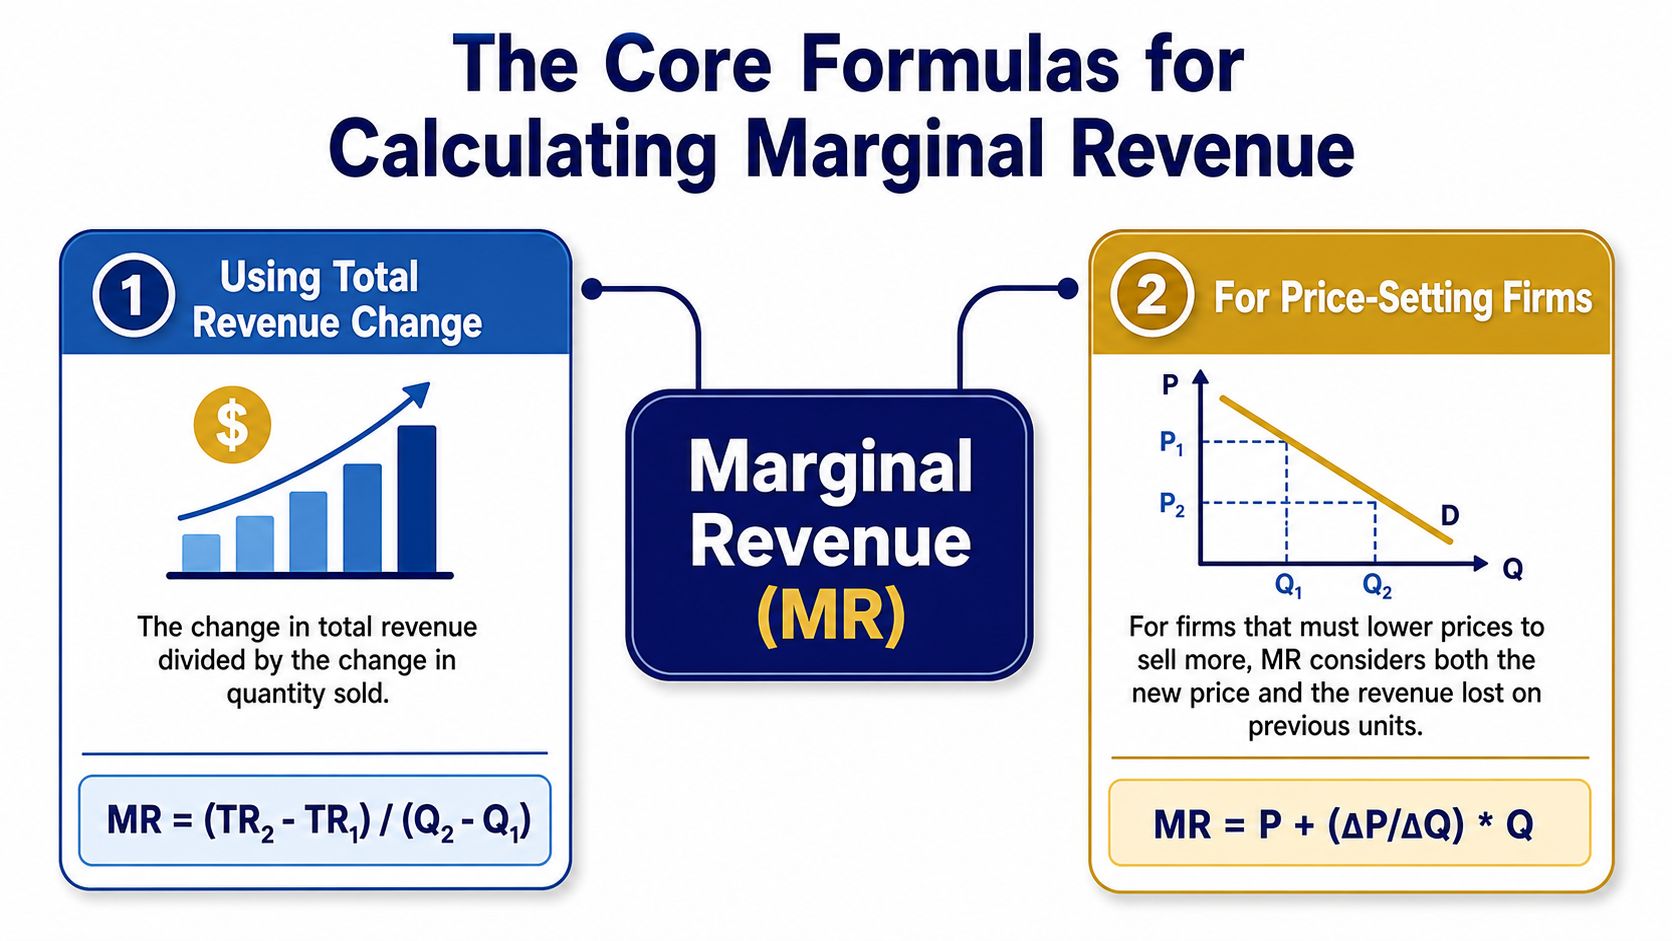
The simplest way to calculate marginal revenue is to compare two sales points. Take the change in total revenue and divide it by the change in quantity, which gives you the average revenue gained for the extra units in that interval. Finance references commonly describe marginal revenue as a change in total revenue over a change in quantity, which is exactly what this method captures.
Variable | Meaning |
|---|---|
TR | Total revenue |
Q | Quantity sold |
ΔTR | Change in total revenue |
ΔQ | Change in quantity sold |
The two-point formula
The working formula is:
MR = (TR₂ - TR₁) / (Q₂ - Q₁)
Use it when you have two observed revenue points, such as before and after a discount. It's practical because it matches how business data often arrives, one campaign, one pricing test, one month at a time.
The derivative view
For continuous pricing analysis, the conceptual formula is:
MR = d(TR) / dQ
That version describes the instantaneous rate of change in total revenue as quantity changes. It's the cleaner theoretical form, while the two-point method is the practical approximation many businesses use in spreadsheets.
Useful distinction: The two-point formula tells you what happened across an interval. The derivative tells you the slope at a moment.
For price-setting firms, the more advanced view often includes price and quantity together, because the next sale can change both. That's one reason the calculator is best treated as a model, not a verdict.
Step-by-Step Worked Examples for Your Business
A calculator gets more useful once the numbers feel familiar. The easiest way to understand marginal revenue is to see how it behaves when a price change affects both volume and total revenue.
Example 1, a physical product with a price cut
A store sells a product at one price, then tests a discount. The question isn't just whether more units sold. It's whether the extra revenue from the added units outweighed the revenue lost on the lower price.
Scenario | Price | Quantity | Total revenue |
|---|---|---|---|
Before discount | higher price | fewer units | lower total revenue |
After discount | lower price | more units | higher or lower total revenue, depending on the result |
The calculation is straightforward. Subtract the first total revenue from the second, then divide by the change in quantity. If the result is positive, the discount brought in more revenue per extra unit within that interval. If it's negative, the store sold more, but gave away more revenue than it gained.
Example 2, paid access for a Discord community
A creator charges for access to a private community and changes the offer structure. That could mean a new tier, a different bundle, or a shift in what members receive. The relevant question is the same, did the new member or upgraded member add meaningful revenue after accounting for the pricing change?
For creators, the list price vs net price distinction becomes practically significant, because the visible price isn't always the revenue that lands in the business.
A common mistake is treating every added member as identical. In paid communities, the next member may come from a lower-priced tier, a limited-time offer, or a bundled access package. The calculator still works, but only if the revenue points match the actual offer being sold.
Revenue math is only useful when the two points describe the same business reality, not just two random prices.
Build Your Own Calculator in a Spreadsheet or Code
A spreadsheet is usually enough. Put Quantity in column A, Price in column B, and Total Revenue in column C. Then use a formula like =A2*B2 for revenue, and in the next row calculate marginal revenue with =(C3-C2)/(A3-A2).
If you want a cleaner setup, create a small table with these columns:
A | B | C | D |
|---|---|---|---|
Quantity | Price | Total Revenue | Marginal Revenue |
In D3, enter =(C3-C2)/(A3-A2) and fill it down. That gives you an interval-by-interval view of how revenue changes as quantity moves.
For teams that want a reusable tool, custom logic can help. If you need something more specific than a sheet, a service like custom calculator development is the kind of option businesses use when they want the calculator embedded in a dashboard or customer workflow.
Simple JavaScript version
Simple Python version
The code is intentionally plain. It works best when your inputs are already cleaned up, because bad pricing data creates bad conclusions fast.
Later in the workflow, a dashboard view can help non-technical teams review the same data without opening the sheet every time. That's where practical reporting matters as much as the formula itself.
If you're building calculators for recurring pricing, subscriptions, or lead-gen funnels, the structure matters more than the math. A small pricing change in one field can produce a completely different revenue result in another field, so the calculator has to mirror the offer structure, not just the math template.
Interpreting Marginal Revenue and Common Pitfalls
A number on its own doesn't tell you whether the pricing move was smart. The useful question is what caused the change, and whether the new result fits the way the business earns revenue.
What negative MR is really saying
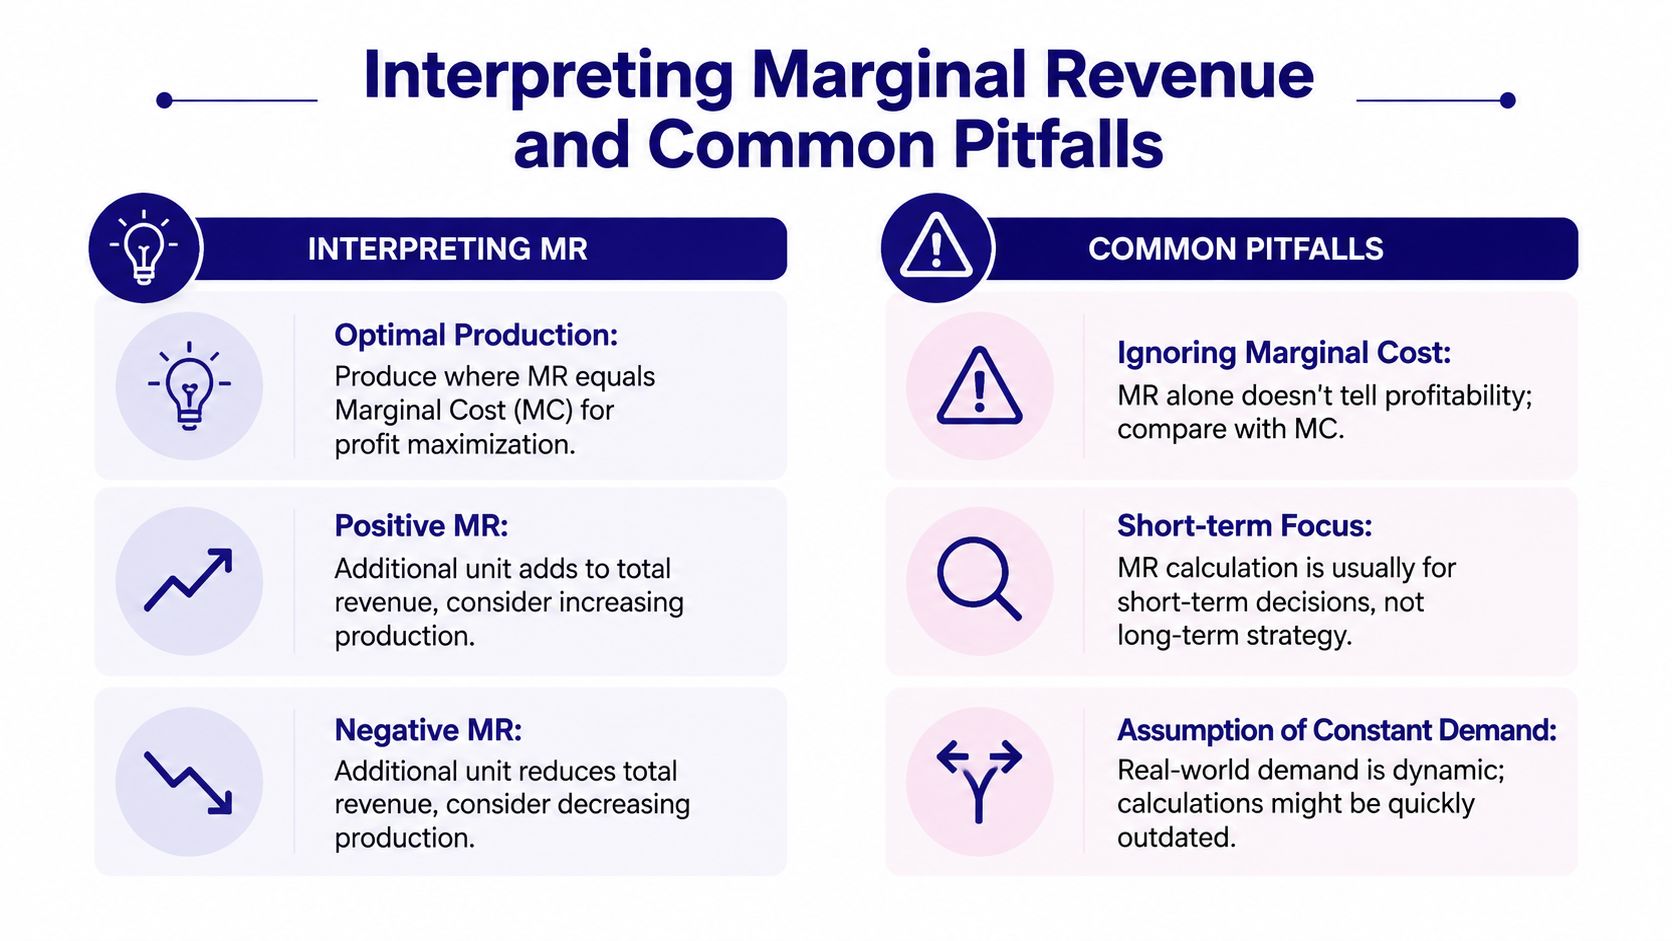
Negative marginal revenue means the extra sale reduced total revenue. That can happen after a price cut, especially when the added volume doesn't make up for the lower price on the earlier units. It can also show up when the sale is tied to a subscription seat, booking, or campaign segment and the “next unit” has a different revenue effect than expected.
Negative MR is a warning sign, not a spreadsheet glitch.
The right response is to ask what changed operationally. Churn, conversion, returns, and capacity constraints often matter more than the number itself. A calculator without those diagnostics can't tell you whether the problem is pricing, demand, fulfillment, or customer mix.
The issue gets sharper in businesses with nonlinear revenue curves. The reference on the marginal revenue calculator notes that many tools oversimplify reality and miss cases where discounts, bundles, or tiered SaaS pricing make the basic two-point result misleading, especially when the “one more unit” assumption fails. That's the exact trap many founders fall into when they plug in two prices and assume the answer is enough.
When the simple result is misleading
For subscriptions, bundles, and tiered packages, the next sale may not be comparable to the last one. An upgrade can change the entire revenue curve, which means the interval average can hide what's really happening at the margin. In those cases, a pricing or elasticity model may be more useful than a raw two-point calculator.
The internal guide on revenue reporting is relevant here because the interpretation layer should match the reporting layer. If your books, dashboard, and pricing logic don't describe the same transaction flow, the marginal result can look clean while the business reality stays messy.
A quick decision rule
Use a simple interval average when the business is stable and the two points are genuinely comparable.
Use a derivative-style approximation when you want a better local estimate around one price point.
Use a pricing or elasticity model when tiers, bundles, or discounts change the structure of the sale.
The bigger mistake is treating marginal revenue as a standalone answer. It works best alongside marginal cost, customer behavior, and the reason the revenue changed.
Putting Marginal Revenue Insights to Work
Once you understand the number, the primary value comes from changing the offer. Marginal revenue helps you decide whether to keep a promotion, tighten a discount, reshape a tier, or stop chasing volume that doesn't improve revenue quality.
That matters most in recurring and digital businesses. Subscription pricing, community access, and mixed payment flows all create more opportunities for smart pricing, but they also create more ways to misread the impact of one extra sale. The guide on subscription pricing models fits naturally with that problem, because the structure of the offer drives the revenue curve.
If you need to act on those insights, the payments stack has to support the model. Suby is built for businesses that want customers to pay by card or crypto and want to receive funds in the way they prefer, including bank accounts or stablecoins like USDC. It's also set up with native integrations for Discord and Telegram, which makes it practical for subscriptions, paid access, and online communities.
The cleanest operating model is simple. Let customers pay the way they want, and let the business receive the money the way it wants. That flexibility makes pricing tests easier to run, because the payment layer doesn't fight the pricing strategy.
If you're testing pricing, subscriptions, or paid access, visit Suby and see how its API, native Discord and Telegram integrations, and multi-method settlement can support your revenue decisions. It's a practical way to keep customers flexible on payment while you stay in control of how revenue lands.
