

Gaspard LEZIN
Subscription Cohort Analysis: A Practical Growth Playbook
Learn subscription cohort analysis step by step, from defining cohorts and tracking LTV and churn to interpreting results and driving growth decisions.
Stop trusting your blended retention rate. In most dashboards I've audited, that single number mixes trial users who never paid, annual plans that can't churn yet, and customers whose cards failed. It moves, the team reacts, and the fix targets the wrong problem. Good subscription cohort analysis doesn't start with a chart. It starts with separating acquisition quality from billing mechanics, so you can tell whether customers stopped valuing the product or never got a fair chance to renew.
Table of Contents
Why Most Subscription Cohort Analysis Leads to Wrong Conclusions
The popular advice sounds clean. Group subscribers by signup month, track what share is still active later, compare the rows. It's also where the mistakes begin, because two cohorts with the same signup label often aren't comparable at all. One may be full of discounted trials, the other full price direct buyers.
Billing duration alone can rewrite the story. Guidance on subscription retention benchmarks by billing duration reports median one year retention of 28% for annual subscriptions, versus 11% for monthly and 3% for weekly subscriptions. That's not proof that annual customers love you more. Annual customers face fewer renewal decisions in that year, so survival looks stronger by construction.
The traps hiding inside a blended curve
Before you calculate anything, check what your cohort is blending together.
Trial and introductory offers: Trial starters haven't made a paid commitment, so mixing them with paid subscribers inflates early drop off and makes acquisition look worse than it is.
Plan mix shifts: A month that sold more annual plans will look healthier than a month that sold monthly, even if product value is identical.
Calendar age versus billing cycles: Month 3 can mean 90 days since signup, three invoices, or the third renewal opportunity. Those are different measurements answering different questions.
Involuntary churn: A failed payment isn't a cancellation decision, yet most exports lump both into churn and send the product team hunting for a value problem.
Terms shape behavior too, which is why it's worth reading how clear renewal language is handled in practice, for example in billing terms for medical courses from ProMed Certifications. If customers don't understand when and how they'll be charged, your curve will show confusion at renewal, not weak demand.
Practical rule: A worsening blended retention rate may reflect a changing plan mix or payment failure exposure, not declining product value. Diagnose the mechanism before you change the product.
The fix is discipline before calculation. Decide which question you're answering, which mechanics you're normalizing, and which definition of a paid subscriber you'll use consistently. Only then does a cohort table become a diagnostic tool instead of a reporting ritual.
Defining Cohorts the Right Way
One cohort definition can't answer every question, so don't force it to. Build four parallel views and use each one where it fits. The views overlap, and that's the point. When they disagree, the disagreement itself is the insight.
The diagram below maps the main ways to slice a starting group before you track it forward.

Four views worth maintaining
Signup date retention groups people by when they first signed up, trials included. Use it to judge acquisition channels and onboarding, because it shows the full funnel from first touch to paid survival.
First paid invoice retention starts the clock at the first successful charge. This is the cleaner view for product value, since everyone in it has paid. A customer who trials, converts late, then stays looks weak in the signup view and strong here, and both readings are true for different questions.
Renewal event retention: Count renewal opportunities, not calendar months. An annual subscriber at their first renewal is comparable to a monthly subscriber at their first renewal in one specific sense, they've each faced one decision to continue.
Revenue retention: Track the money a cohort generates over time, not just headcount. This view catches downgrades, upgrades, and pauses that logo retention hides completely.
If you're unsure how the customer facing side should read, it's useful to ground the mechanics in a plain explanation of how subscriptions work from PetScy, since the definitions you show customers at signup are the ones your data should mirror.
Separate the churn types at definition time
Tag every exit as voluntary or involuntary from day one. A deliberate cancellation, a refund, and a card that fails after retries are three different events with three different fixes. If you don't separate them in the source data, you can't separate them later without guesswork.
Use paid subscribers consistently, keep trial cohorts apart from direct paid cohorts, and never compare 90 days against three billing cycles as if they're the same milestone.
At signup, capture plan, billing cycle, trial flag, introductory discount flag, acquisition source, payment method, and country. That tagging is cheap at capture and nearly impossible to reconstruct later. Choose the cohort definition that matches the decision in front of you, then hold it steady across comparisons.
The Core Metrics That Actually Move Decisions
Four metrics do most of the work in a cohort review. Everything else is supporting detail. The image below sets them side by side, and the rest of this section explains how they connect.

Customer retention is the share of a starting cohort still active at a later point. Churn rate is the share that left in a period, and if you want the mechanics spelled out step by step, calculating churn rate correctly for subscription cohorts covers the denominator choices that trip teams up. Both metrics count people. Neither tells you what those people are worth.
Lifetime value, or LTV, fills that gap. In plain terms, it's the revenue a typical customer generates across their whole relationship with you, which makes it the number that disciplines acquisition spend. A channel that brings cheap signups who leave at the first renewal can look efficient until LTV exposes it.
Where revenue retention changes the verdict
Gross revenue retention measures how much starting revenue a cohort keeps after downgrades, contractions, and churn, without credit for expansion. Net revenue retention, or NRR, adds expansion back in. Put both on the same dashboard, because the gap between them tells you whether growth inside the cohort is masking leakage underneath.
High retention, shrinking spend: Customers stay but downgrade or cut usage, so logo retention looks healthy while unit economics worsen.
Lower retention, strong expansion: Fewer customers remain, but those who do spend meaningfully more, and reactivated customers add revenue back.
One off purchases: Episodic revenue can flatter a single month, so report it separately from recurring expansion or you'll mistake a spike for durability.
This pattern shows up outside software too. Membership businesses run into the same trap, and Gym Membership Tips retention advice makes a similar point about reading retention alongside what members do and spend. The lesson travels well across models.
The best cohort isn't always the one with the highest subscriber survival. A lower retention cohort with strong expansion and reactivation can produce more durable cash flow.
Research on hybrid monetization combining subscriptions with usage and one time purchases points in the same direction, since mixed models can outperform on growth and average revenue per account. That's exactly why your metric set needs revenue views, not just headcount. Report retention, churn, LTV, gross revenue retention, and NRR together, and you'll have numbers you can defend in a leadership review.
Reading a Cohort Curve Month by Month
Follow one cohort across its first year and the curve stops being abstract. The chart below is the kind of shape worth learning to read, with distinct behavior early on and again near renewal.
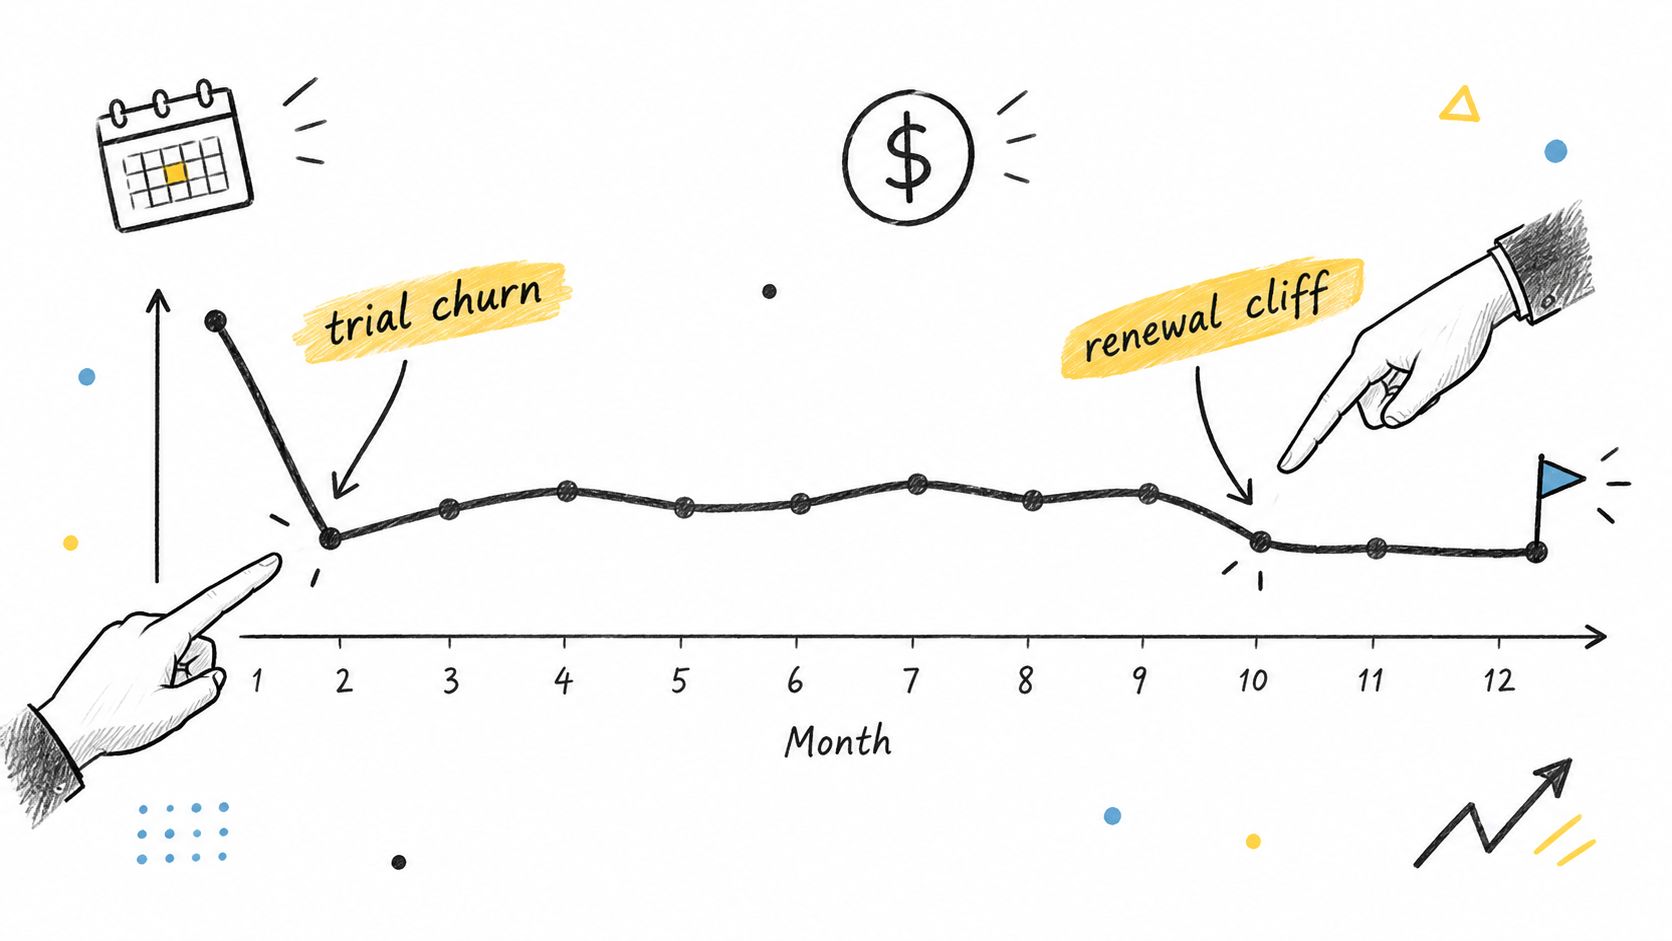
The first bend usually arrives fast. Trials end, introductory pricing expires, and customers who signed up out of curiosity leave. Don't panic at that drop and don't celebrate avoiding it either. Ask who left. If trial users dominate the exit, you have an onboarding or expectation problem. If full price buyers leave at the first real charge, you have a value or price shock problem.
What each phase is really telling you
After billing settles in, a healthy curve flattens. The remaining customers have paid at least once, found their use case, and churn more slowly. A curve that keeps sliding at the same steep angle month after month is different. That shape suggests the product never becomes a habit, and no billing trick will fix it.
Renewal points create their own humps and cliffs, especially on annual plans. A sharp drop at the annual renewal doesn't mean customers suddenly stopped caring in that month. It means a full year of accumulated doubt got expressed at the single moment they could act on it. Read renewal cliffs as a verdict on the whole preceding period.
The long tail is where expansion, contraction, pauses, and reactivation show up. Watch for these patterns:
Healthy curve: Early drop, then a visible flattening, with revenue holding steadier than headcount.
Leaky curve: No flattening, steady losses in both customers and revenue, weak reactivation.
High churn, high expansion curve: Headcount falls but revenue per remaining customer climbs, so the cohort still pays back.
This short walkthrough shows the reading process applied to a live curve, which helps connect each bend to a diagnostic question.
Pauses deserve their own line on the chart. A paused customer isn't retained in the billing sense, but they aren't gone either, and many return. Reactivations matter the same way. If your curve only counts uninterrupted survival, you'll undervalue cohorts that dip and recover.
Building the Tooling and Data Pipeline Behind the Analysis
Cohort quality is decided long before anyone opens a dashboard. It's decided by what your billing system captures at signup and how cleanly events flow afterward. The checklist below covers the fields that make every later query possible.

Capture these fields at signup
Plan and billing cycle: Which tier they chose, and whether they're monthly or annual, so plan mix never contaminates a comparison.
Trial and discount flags: Whether they started on a trial or an introductory offer, and when that offer ends.
Acquisition source: The channel or campaign that brought them, stored on the customer record, not just in an ad platform.
Payment method and country: Card, wallet, bank, BNPL, or crypto, plus market, because renewal friction varies by both.
Then wire the event stream. Every successful payment, failed payment, retry outcome, refund, plan change, pause, cancellation, and reactivation should land in your warehouse or analytics layer with a timestamp and a reason code where one exists. If you want a primer on structuring that payment data, building payment analytics that surface retention signals is a practical starting point.
Your payment stack choice matters, since clean webhooks and a real time dashboard shorten the path from event to insight. One option is Suby, a single product you can use four ways. Suby Payments is an API first stack to accept cards and crypto through one checkout. Suby Crypto handles the swap, sponsors the gas, and settles to a non custodial wallet or to the Suby balance. Suby Gating provides paid access for Discord, Telegram, downloads, and courses. Suby Invoicing lets the client pay how they want while the business receives what it wants. The API lets any business accept payments by card or crypto, and native Discord and Telegram integrations support subscriptions, paid access, and online communities. Customers pay any way they want, by card, wallet, bank, or crypto, and businesses choose settlement to a bank account or in stablecoins like USDC, including the flow where a customer pays by card and the business receives USDC. Pricing depends on the payment method used, so check the pricing page for exact figures rather than assuming one flat rate.
Pipeline test: Pick one customer who churned last month and reconstruct their full story from your data, signup terms, every invoice, every failure, every change. If you can't, your cohorts are estimates.
Segmentation comes last, not first. Once the fields exist, you can slice by plan tier, channel, country, payment method, or discounted versus full price entry, and each slice stays trustworthy. Build the exports once, document the definitions next to them, and rerun the same queries every month so changes reflect reality, not redefined math.
Turning Cohort Output Into Growth Decisions
A finished cohort report should end in assignments, not observations. Each pattern points to a different lever, and pulling the wrong one wastes a quarter. Start by matching the shape you see to the mechanism behind it.
Match the pattern to the lever
Steep early drop tied to failed payments: Fix dunning and retry logic first. Smart retries, card update prompts, and backup payment methods recover customers who never intended to leave, and it's worth reading up on how to reduce churn from failed payments and cancellations before touching the product.
Stable base, weak expansion: The product retains but doesn't grow accounts, so look at usage based add ons, higher tiers, or one time purchases that deepen the relationship.
Sharp annual renewal cliff: Work on renewal reminders, value recaps before the charge, and save offers timed to the decision point, not sprinkled randomly.
Healthy retention, shrinking revenue: Suspect plan mix or contraction, not product failure. Check whether newer cohorts enter on cheaper plans or existing customers keep downgrading.
Benchmarks help you triage, but only when the definitions match. Compare your annual cohorts against annual benchmarks and your monthly cohorts against monthly ones, and keep trial heavy cohorts out of paid comparisons entirely. A number below a public range tells you where to dig. It doesn't tell you what you'll find.
International products need one extra step. Segment by market before concluding anything, because payment methods, renewal friction, and failure rates differ by country. A cohort that looks weak in aggregate may be strong in most markets and broken in one, where a local payment option or retry timing change fixes it.
Set next quarter's targets from cohort evidence. Pick the mechanism your data actually implicates, assign it an owner, and define which cohort view will prove the fix worked.
Keep the playbook short. Three or four actions, each tied to a specific curve pattern, each measurable in the cohort view that exposed the problem. That's how subscription cohort analysis earns its place in the growth process. It stops being a monthly chart review and becomes the reason your team ships the right fix first.
If your cohort data is only as clean as your billing events, start with a payment setup that captures them properly, accepts cards, wallets, bank, BNPL, and crypto, and settles to your bank or in stablecoins like USDC. Visit Suby to see how one checkout and clear subscription reporting can give your team cohort numbers worth acting on.
