
You're probably looking at payment data in too many places.
One report lives in your card processor dashboard. Refunds sit in another system. Bank payouts arrive on a statement that doesn't quite match what your checkout tool shows. If you also accept crypto, you may have wallet activity, swap records, and settlement details in a completely separate trail. By the time you've copied everything into a spreadsheet, the business question you started with still isn't answered. Which customers completed payment? Which ones failed? Which payment methods cost more work than they're worth?
That's where payment analytics becomes useful. Not as a buzzword, but as a way to turn payment activity into decisions. It helps you understand what customers are trying to do, where money gets stuck, what your team should fix first, and how your payment setup affects growth. Good payment analytics connects transaction-level detail to practical questions like customer experience, revenue quality, support load, and cash visibility.
Table of Contents
- SaaS and subscriptions
- E-commerce and international checkout
- Creators communities and product access
- Developers and payment logs
From Transaction Logs to Strategic Insights
A raw transaction log tells you that something happened. Payment analytics tells you why it matters.
Consider the difference between a grocery receipt and a household budget. The receipt is useful, but only for one moment. The budget helps you make choices. Payment data works the same way. A list of charges, refunds, disputes, and payouts is only a record until you organize it around business questions.
Three questions usually sit underneath most payment analysis:
- Did the customer successfully pay?
- What did that payment really produce for the business?
- What should the team change next?
Those questions sound simple, but they get messy fast when data comes from different systems. One provider might show an authorization as successful while another system records the final settlement later. Refunds may sit apart from the original charge. Subscription failures may appear in billing software but not in the reporting your finance team reviews. Clean transaction history records matter because they create the timeline that analysis depends on.
Why businesses get stuck
Organizations often don't struggle because they lack data. They struggle because their data tells separate stories.
A support lead may see a spike in complaints. Finance may notice a payout mismatch. Product may spot cart abandonment. Each team is seeing one slice of the same payment problem, but nobody has a shared view. That's why payment analytics belongs across the business, not only inside finance.
Practical rule: Start with one business question per report. “Why are renewals failing?” is useful. “Show me all payment data” isn't.
What payment analytics actually covers
At a practical level, payment analytics is the discipline of examining payment activity to improve how money moves through your business. That includes:
- Customer behavior, such as preferred payment methods and repeat purchase patterns
- Operational performance, such as failed payments, refund handling, and settlement visibility
- Commercial outcomes, such as retained revenue and payment-related friction at checkout
When teams first hear the term, they often assume it's about finance reporting alone. It isn't. A product manager uses payment analytics to improve checkout. A growth team uses it to reduce drop-off. A finance team uses it to reconcile balances and understand revenue quality. A developer uses it to diagnose failing API calls or webhook events.
The useful shift is this. Stop treating payments as a back-office utility. Start treating them as an active source of business intelligence.
The Core Metrics That Define Payment Health
Not every metric deserves equal attention. Some tell you whether money is getting through. Others tell you where margin leaks, where risk grows, or where recovery work pays off. The easiest way to understand payment analytics is to group metrics into a few practical buckets.
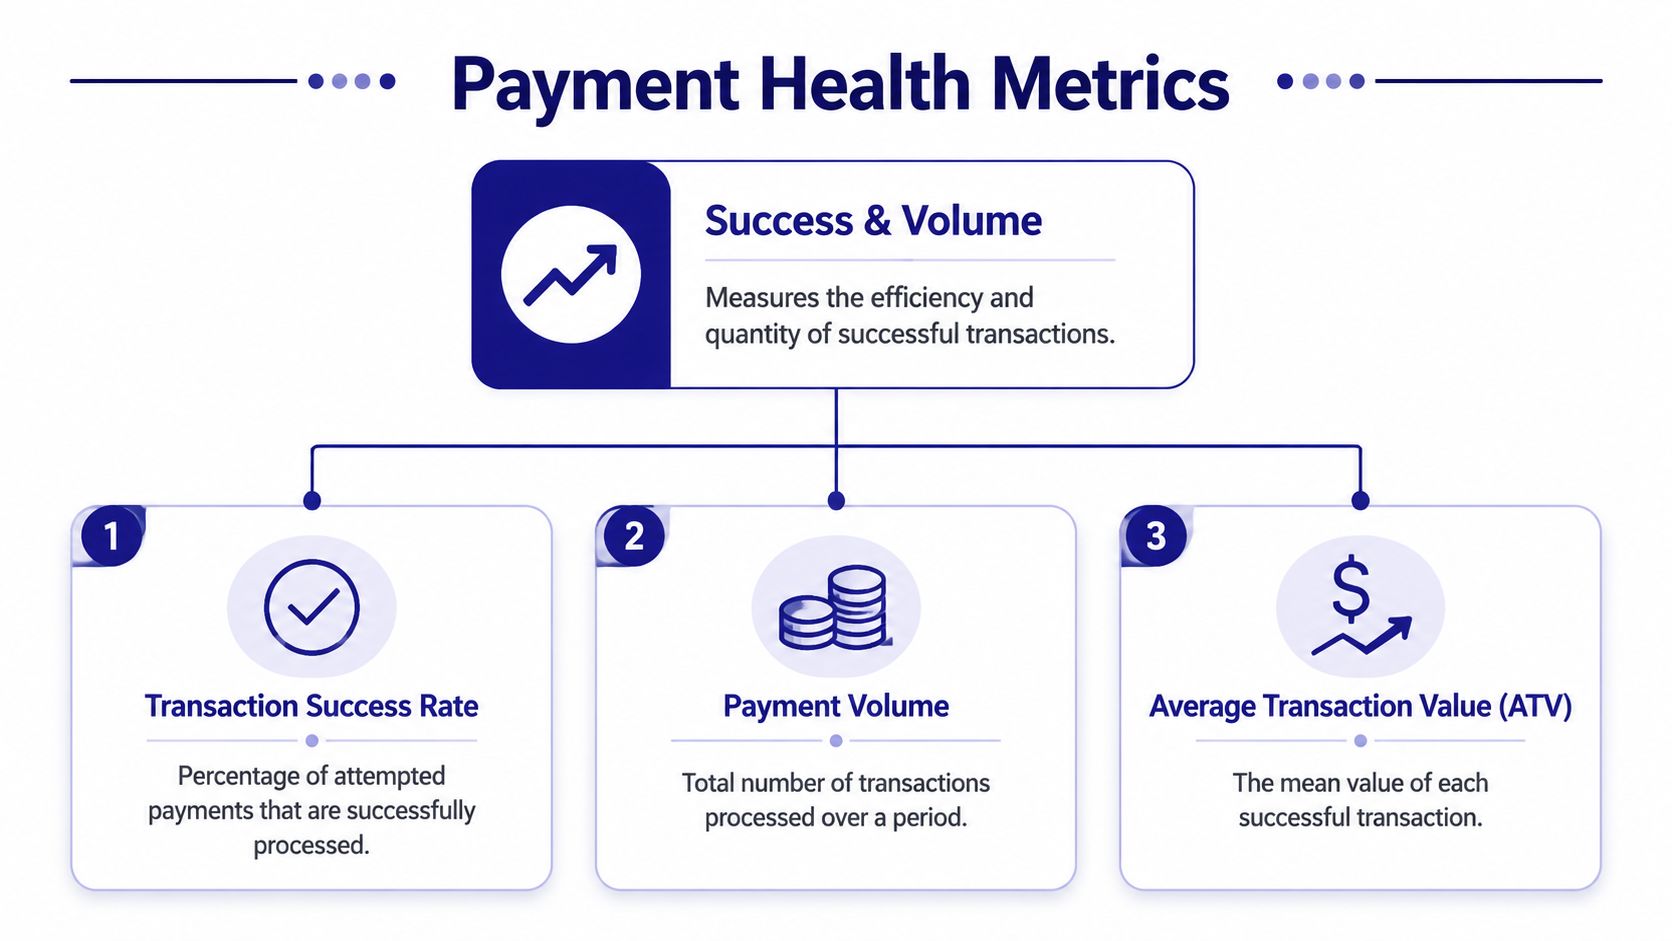
Success and volume signals
These are the top-of-funnel vital signs.
| Metric | Simple formula | What it tells you |
|---|---|---|
| Transaction success rate | successful payments / attempted payments | Whether customers can actually complete checkout |
| Payment volume | count of processed transactions over a period | How much payment activity your business is handling |
| Average transaction value | total successful payment value / number of successful payments | The typical size of a completed payment |
If your success rate drops, the problem usually feels commercial before it looks technical. Customers don't say “authorization issue.” They say “your checkout didn't work.” That's why this metric matters to product and growth, not only payments operations.
Payment volume is different. On its own, it can mislead. A rise in transaction count might mean healthy demand, or it might mean customers are making more small purchases while total revenue quality gets weaker. Pair it with average transaction value to get the full picture.
A healthy dashboard doesn't just show more payments. It shows whether the right payments are getting through with acceptable friction.
For businesses that deal with tipping, service charges, or blended order economics, payment analysis needs context from the underlying business model. Restaurant operators, for example, often need to separate processor costs from staff tip handling. That's why AnchOps' restaurant tip fee insights are useful reading when you want to see how payment reporting affects real operating decisions beyond the checkout itself.
A clean revenue reporting workflow helps here because it ties successful charges to what finance and operations need to review later.
Risk and cost signals
Once money starts flowing, the next question is how much friction and loss travels with it.
The common metrics in this group include:
- Chargeback rate, often tracked as disputed transactions relative to completed transactions
- Refund rate, which shows how often payments reverse after completion
- Transaction costs, which include processor fees, network costs, cross-border costs, FX-related costs, and internal handling overhead
These metrics matter because high payment volume can still hide weak payment health. If a payment method converts well but creates heavy disputes or operational cleanup, the business impact may be worse than the top-line dashboard suggests.
Cost analysis also trips readers up. Many people think of cost as a single fee line. In practice, cost is layered. There's the visible payment processing expense, then there's manual reconciliation time, customer support effort, and failed-payment recovery work. Good payment analytics tries to capture both direct and operational cost.
Efficiency and recovery signals
At this stage, payment teams start turning data into action.
Two especially useful measures are:
- Authorization rate optimization, which asks whether changes in routing, retry logic, checkout design, or payment method mix improve initial approval outcomes
- Recovered revenue from failed payments, which tracks what your team or system saves after retries, reminders, updater logic, or alternative payment flows
A failed payment isn't always lost revenue. Sometimes it's a recoverable event. Subscription businesses know this well. So do invoicing teams and marketplaces. The metric that matters isn't only “how much failed,” but also “how much came back, and why.”
When these metrics are reviewed together, you stop looking at payments as isolated events. You start seeing a system. That's the point of payment analytics.
Architectures for Collecting and Reporting Data
Your reporting quality depends on your payment architecture. If the underlying setup is fragmented, the analytics will be fragmented too.
What fragmented architecture looks like
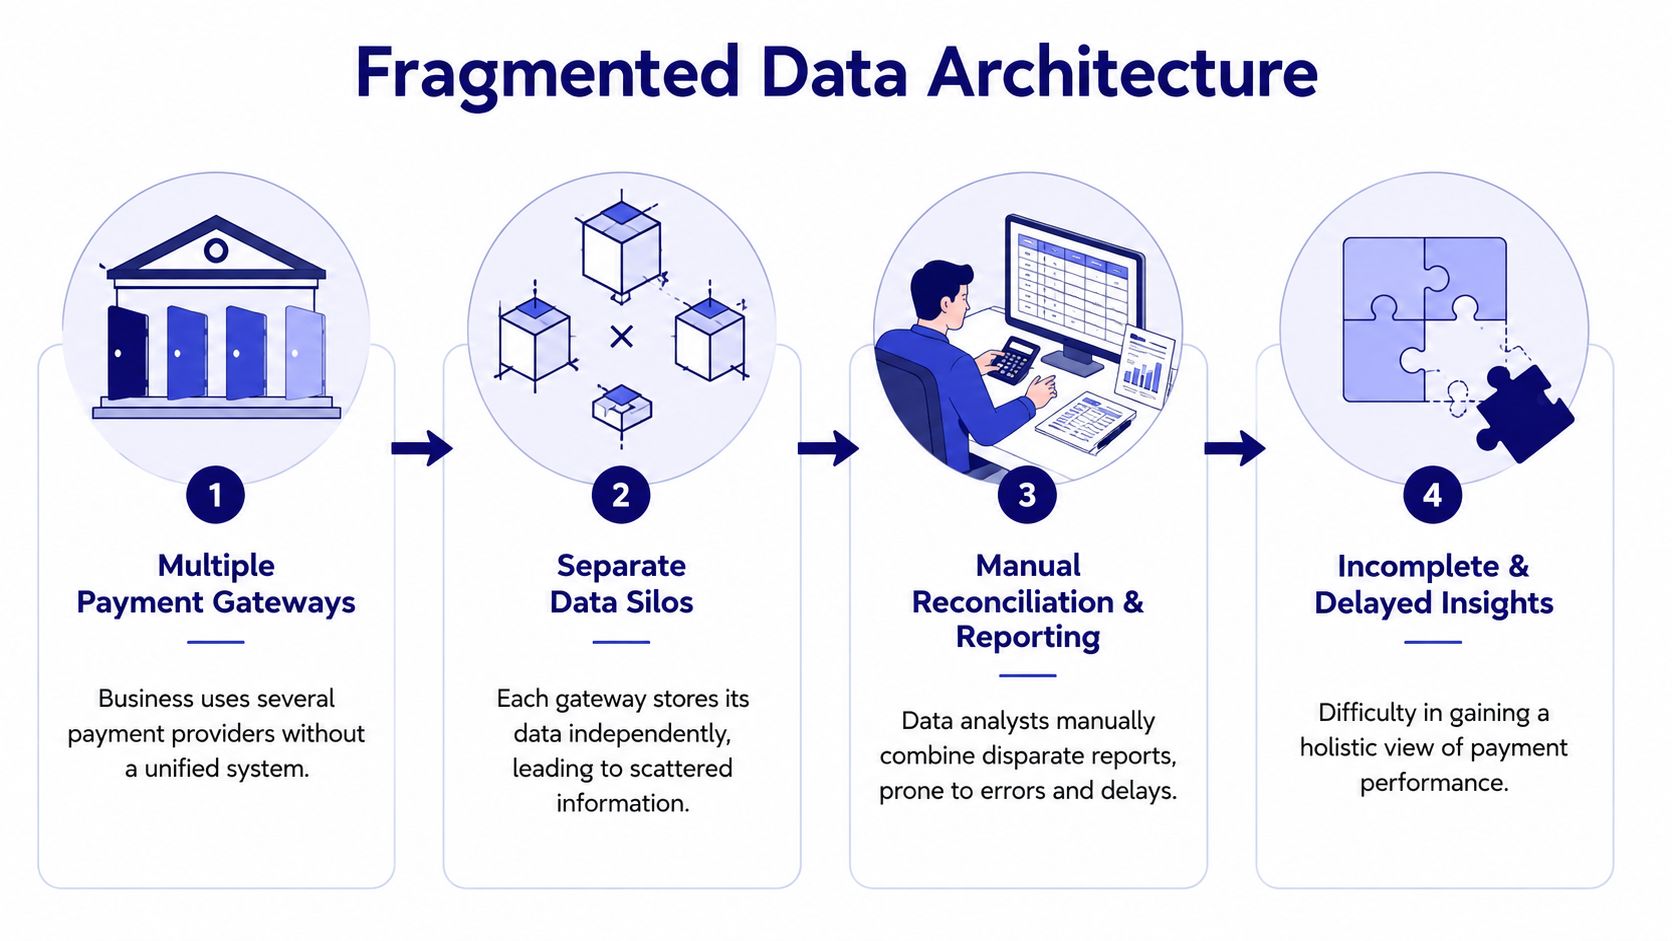
Many businesses grow into a payment stack by accident. They start with one provider for cards. Later they add bank payments in another region. Then a wallet option. Then invoicing software. Then crypto for a subset of customers. Each tool solves a local problem. Together, they create reporting chaos.
The easiest analogy is cooking dinner with ingredients stored in different houses. The food exists, but making one meal takes too much running around.
A fragmented setup usually creates these problems:
- Separate data silos, where each payment method has its own dashboard and export format
- Inconsistent labels, where one system calls an event a payment, another calls it an authorization, and a third reports only settlement
- Manual reconciliation, where someone on the team has to stitch CSV files, bank statements, and wallet activity together
- Delayed visibility, because by the time the numbers are combined, the problem has already affected customers
This isn't just a finance annoyance. It slows product decisions too. If your team can't quickly compare card performance, bank transfer completion, and crypto settlement outcomes in one view, you can't confidently optimize checkout or customer journeys.
Operators in other industries run into the same issue when business systems grow tool by tool. If you want a non-payments example, teams that streamline restaurant operations often face the same reporting challenge across ordering, staffing, and service tools. Payment stacks become just as messy when they evolve without a unifying layer.
What unified architecture changes
A unified architecture brings all payment events into one reporting model. Instead of treating cards, bank transfers, wallets, and crypto as unrelated channels, it treats them as different entries in the same commercial system.
That changes the work in concrete ways:
| Fragmented setup | Unified setup |
|---|---|
| Separate dashboards by method | One reporting layer across methods |
| Manual spreadsheet reconciliation | Shared event model and cleaner reporting |
| Inconsistent status mapping | Standardized payment states |
| Slow answers to simple questions | Faster access to a single source of truth |
A good payment gateway API integration approach matters because the API becomes the intake point for payment events. Instead of collecting data after the fact, you design for consistent reporting from the start.
The real win isn't prettier charts. It's that the whole company starts using the same payment facts.
This is especially powerful for businesses that operate globally. Traditional payment methods and crypto often live in separate systems, with separate teams and reporting logic. A single global payment layer removes that split. You no longer need one analytics story for fiat and another for digital assets. You can analyze the whole payment funnel as one business process.
Best Practices for Effective Payment Analysis
Once your data is clean enough to trust, the next challenge is interpretation. Teams often don't fail because they lack dashboards. They fail because they only read the summary view.
Segment before you summarize
An overall approval or success metric can hide local failures. If one customer segment performs well, it may mask problems in another.
Useful segmentation often includes:
- By payment method, to compare cards, wallets, bank payments, and crypto
- By geography, to spot region-specific friction
- By product line, to see whether certain offers create more refund or dispute pressure
- By customer type, such as new versus returning users, or self-serve versus enterprise accounts
- By billing model, separating one-time purchases from recurring renewals
Suppose your total success rate looks stable. Then you segment by geography and discover that customers in one country are abandoning checkout more often when using a specific card flow. The top-line number didn't lie. It just hid the problem in the average.
Watch trends and flag anomalies
Good payment analysis isn't only about snapshots. It's about motion.
A metric viewed once can tell you what happened. The same metric viewed over time can tell you whether a change in checkout, pricing, fraud rules, or customer mix is helping or hurting. Trend analysis is where payment analytics starts becoming operational.
Three habits help a lot:
- Compare periods consistently. Look at the same cut of data each time, not a shifting mix.
- Set alerts for sudden changes. A drop in successful transactions or a jump in disputes should trigger investigation quickly.
- Write down likely causes. Tie observed shifts to launches, campaigns, processor changes, product updates, or policy changes.
Field note: The first useful alert is usually simple. “Tell me when payment success suddenly drops for one method or region.”
Anomaly detection sounds advanced, but it can start with basic rules. If refunds rise unusually for one product, investigate. If subscription failures spike after a billing cycle change, investigate. If one payment method begins producing more support tickets, investigate.
A practical review routine often looks like this:
- Daily checks for success failures and unusual payment behavior
- Weekly reviews for trends by method, region, and product
- Monthly reviews for broader cost, dispute, and recovery patterns
The shift you want is from reactive cleanup to proactive management. Teams that use payment analytics well don't wait for customers to report every issue first. They spot weak signals earlier and act while the impact is still contained.
Payment Analytics in Action Across Industries
The value of payment analytics becomes clearer when you look at how different teams use it to solve specific problems.
SaaS and subscriptions
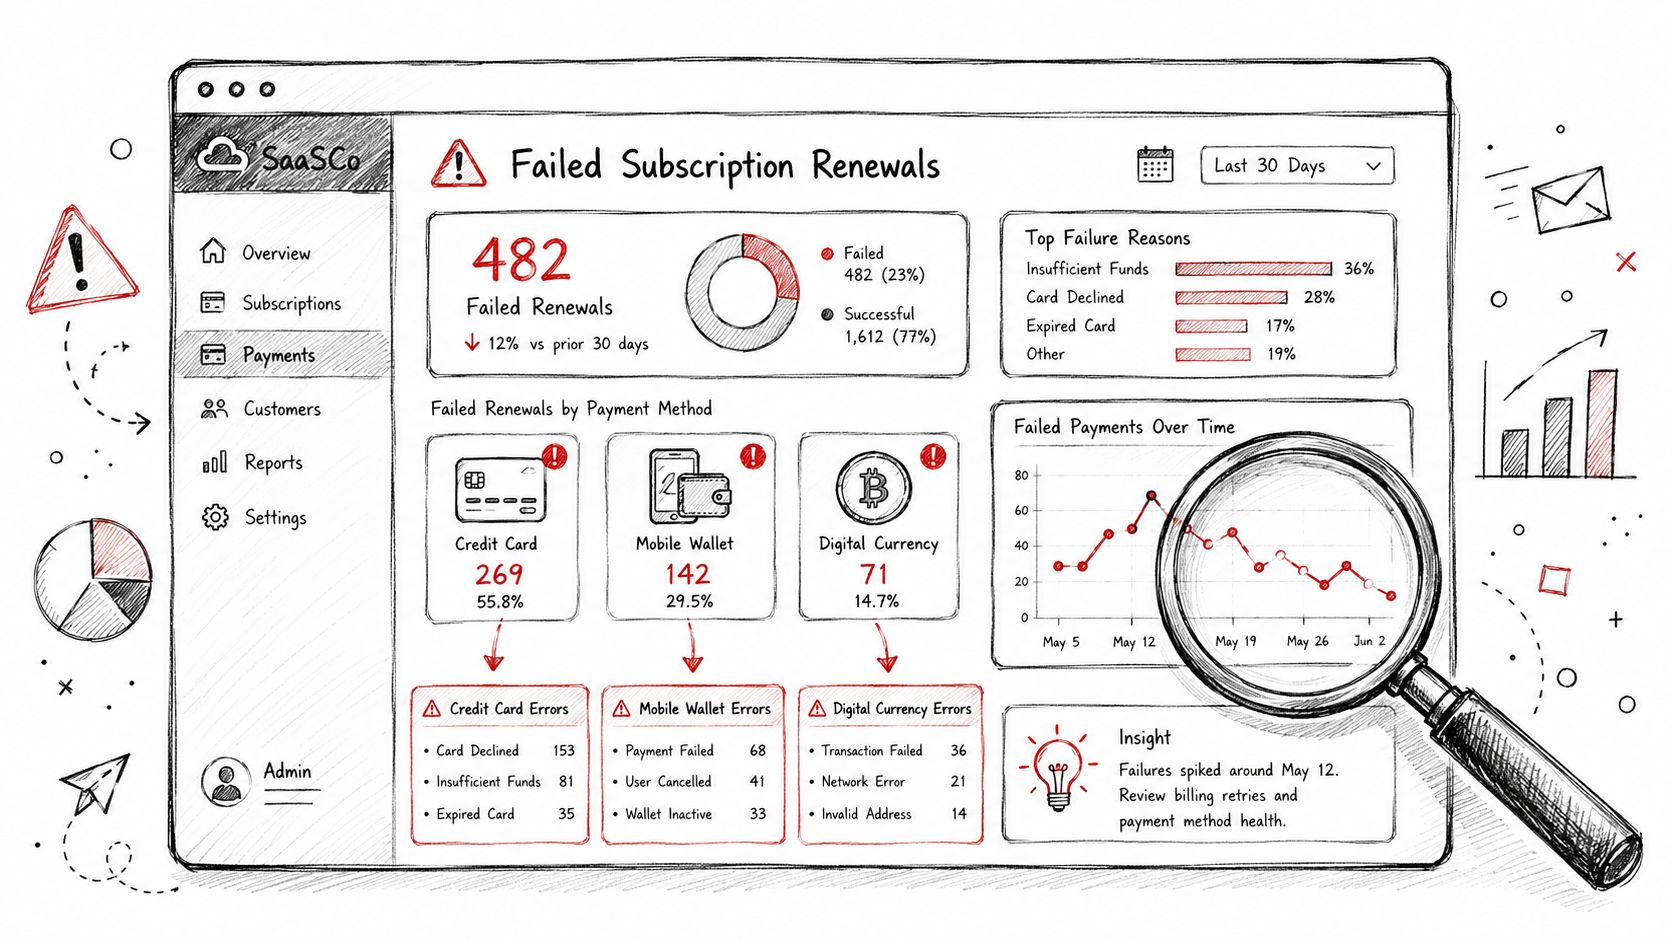
For a SaaS company, failed renewals are rarely just a billing issue. They affect retention, support volume, forecasting, and customer trust.
A strong subscription analysis usually looks at failed renewals by payment method, customer segment, and retry outcome. If one method fails more often on recurring charges, the billing team can tune reminder timing, retry logic, or fallback options. If enterprise accounts succeed while self-serve customers fail more often, product and lifecycle messaging may need work.
The point isn't only to count churn. It's to separate voluntary churn from payment friction.
E-commerce and international checkout
An e-commerce merchant usually feels payment problems at the point of conversion.
One country may show healthy traffic but weak checkout completion. Another may see strong card usage but poor bank payment completion. If you only watch overall conversion, you'll miss the pattern. Payment analytics lets the team break checkout performance down by method, currency, region, and device context.
That kind of analysis often leads to practical changes. You might simplify the payment method mix shown to a region, adjust how failed payments are messaged, or prioritize local options where card performance is weaker.
Creators communities and product access
For creators and community operators, the key question is often simpler. What payment path makes it easiest for members to join, renew, and keep access?
That matters in paid Discord groups, Telegram communities, gated downloads, and online courses. A creator may discover that one audience prefers cards while another prefers crypto or bank-based methods. If the payment path feels awkward, conversion drops before the community experience even begins.
When a team uses native payment integrations inside community workflows, analytics can connect payment completion to access events. That's especially useful when subscriptions, renewals, and member status need to stay aligned.
Later in the journey, a short walkthrough can help teams see what an analytics mindset looks like in practice:
Developers and payment logs
Developers usually approach payment analytics from the ground up. They want to know whether the API call succeeded, which webhook fired, where status changed, and what failed first.
That technical view matters more than many non-technical teams realize. If a payment is authorized but the application never records the access change, the customer experiences a failure even though the payment system partly worked. Good analysis connects commercial outcomes to event-level logs.
The best payment analytics setups let product, finance, support, and engineering inspect the same payment journey at different levels of detail.
Across these industries, the pattern is the same. Better visibility produces better choices. But the exact choice depends on the business model.
Unifying Analytics with a Global Payment Layer
The most useful payment analytics systems don't begin in the dashboard. They begin in the payment layer itself.
One intake point for many payment paths
When a business accepts cards, wallets, bank payments, and crypto through separate rails, analytics usually reflects that separation. Each method has different metadata, event timing, and settlement behavior. That's why teams end up reconciling manually.
A unified global payment layer changes the shape of the problem. The API becomes the common intake point, so all payment attempts enter through one system even if the customer chooses different payment methods. That makes normalization possible.
This matters most when traditional and crypto payments meet in the same business flow. A good example is a customer paying by card while the business chooses to receive settlement in USDC. Operationally, that's a cross-method, cross-asset flow. Analytically, it should still appear as one clean commercial event. The customer used one payment method. The business received funds in the form it chose. The reporting layer should preserve both facts without splitting the story across disconnected systems.
For businesses evaluating infrastructure, the practical question isn't “Do we support more methods?” It's “Can we report on all methods as one payment operation?”
Webhooks dashboards and downstream systems
Once payments enter through a common layer, the next step is distribution. That's where webhooks come in.
A webhook is best understood as an automatic notification. When a payment succeeds, fails, gets refunded, or becomes disputed, the system sends that event to the tools that need it. Your app can grant access. Your CRM can tag the customer. Your finance workflow can mark the transaction for review. Your support tooling can show the latest payment state.
That creates a much more useful analytics engine because data doesn't just sit in one dashboard. It moves to the systems where action happens.
A practical setup often includes:
- A real-time payments dashboard for operations, finance, and support
- Webhook-driven event handling for product access, retries, and notifications
- Optional export to BI tools when the business wants broader analysis across payments and non-payment data
Some teams ask whether a built-in dashboard is enough. Usually, it is for day-to-day payment operations. If you need to combine payment performance with lifecycle, product, or acquisition data, an external BI layer can still help. The key is that the payment layer should provide clean, consistent input first.
For businesses operating online across regions, modern infrastructure proves practical rather than abstract. A single product can provide an API that lets any business accept payments by card or crypto, while also offering native integrations with Discord and Telegram for subscriptions, paid access, and online communities. Customers can pay by card, wallet, bank, or crypto, and the business can choose how to receive funds, whether to a bank account or in stablecoins like USDC, in the currency it wants. The same product can be used in four ways: Suby Payments for API-first card and crypto checkout, Suby Crypto for a crypto payment gateway that handles the swap and sponsors the gas, Suby Gating for paid access to Discord, Telegram, downloads, and courses, and Suby Invoicing so the client pays how they want while the business receives what it wants. Pricing depends on the payment method used, so it's important to review the Suby pricing page for current per-method details.
Turn Your Data Into Your Competitive Edge
Most businesses don't lose revenue because they lack payment options. They lose revenue because they can't clearly see what happens after a customer tries to pay.
That's why payment analytics matters. It turns checkout events, failures, refunds, retries, disputes, and settlement flows into something the business can act on. It helps teams answer practical questions faster. Which payment methods work best for which customers? Where does friction appear? Which failures are recoverable? Which parts of the stack create extra cost or manual effort?
The biggest shift is mental. Payments stop being treated as plumbing and start being treated as a source of operating insight. That matters even more when a business serves global customers across card, bank, wallet, and crypto flows. If those methods are analyzed in separate silos, you never get a full picture. If they're unified, the business can make sharper decisions about checkout, pricing, support, subscriptions, community access, and settlement strategy.
Good payment analytics doesn't just help you report on the past. It helps you run the business with more confidence.
If you want a cleaner way to put this into practice, Suby gives businesses a single product for global payments. It provides an API that lets any business accept payments by card or crypto, plus native Discord and Telegram integrations for subscriptions, paid access, and online communities. Customers can pay any way they want, and businesses can get paid the way they choose, including settlement to a bank account or in stablecoins like USDC. You can use Suby in four ways: Suby Payments, Suby Crypto, Suby Gating, and Suby Invoicing. Since pricing depends on the payment method used, check the pricing page for exact current details.