

Gaspard LEZIN
Stripe Fees Explained: A 2026 Guide to Your Real Costs
Demystify Stripe fees in 2026. Our guide breaks down card processing, international charges, and hidden costs to reveal your true effective rate.
Most advice about Stripe fees starts and ends with 2.9% + $0.30. That's the familiar number, and for a simple domestic card charge it's a useful baseline. But it's also the reason many new online businesses feel confused when the payout that lands is lower than the rough math they did in their head.
The gap usually isn't caused by anything mysterious. It comes from treating the advertised card rate as the full cost of acceptance. For businesses selling internationally, that shortcut breaks fast. Multiple guides note the base U.S. card fee of 2.9% + $0.30, but also point to added costs such as 1.5% for international cards and about 1% for currency conversion, which can push the true effective rate well above the headline rate, especially for global SaaS and e-commerce sellers (Wise on Stripe fees).
That matters for margin, pricing, and cash flow. If you sell subscriptions, digital products, or services across borders, your payment processor isn't just a checkout tool. It becomes part of your unit economics.
It also affects accounting. If you're trying to reconcile card payments, pending payouts, and deposits hitting your bank, a clean money-in-transit workflow helps prevent a lot of confusion. This practical overview of QuickBooks guidance for money in transit is useful if your books never seem to match your payment dashboard on the same day.
Table of Contents
A simple example
Where the extra cost comes from
A side by side example
The operational impact
The fee categories that catch teams off guard
Why attached products matter
How to calculate your effective rate
Ways to reduce payment cost pressure
Why some global merchants change the payout model
What that looks like in practice
Are Stripe fees actually hidden
Why is my payout lower than my sales total
When should I look at effective rate instead of the headline fee
Is a card processor always the cheapest option for global revenue
What's the practical difference between acceptance and payout
The Standard Stripe Fee Structure
The headline rate is useful, but it is not the number that protects your margin.
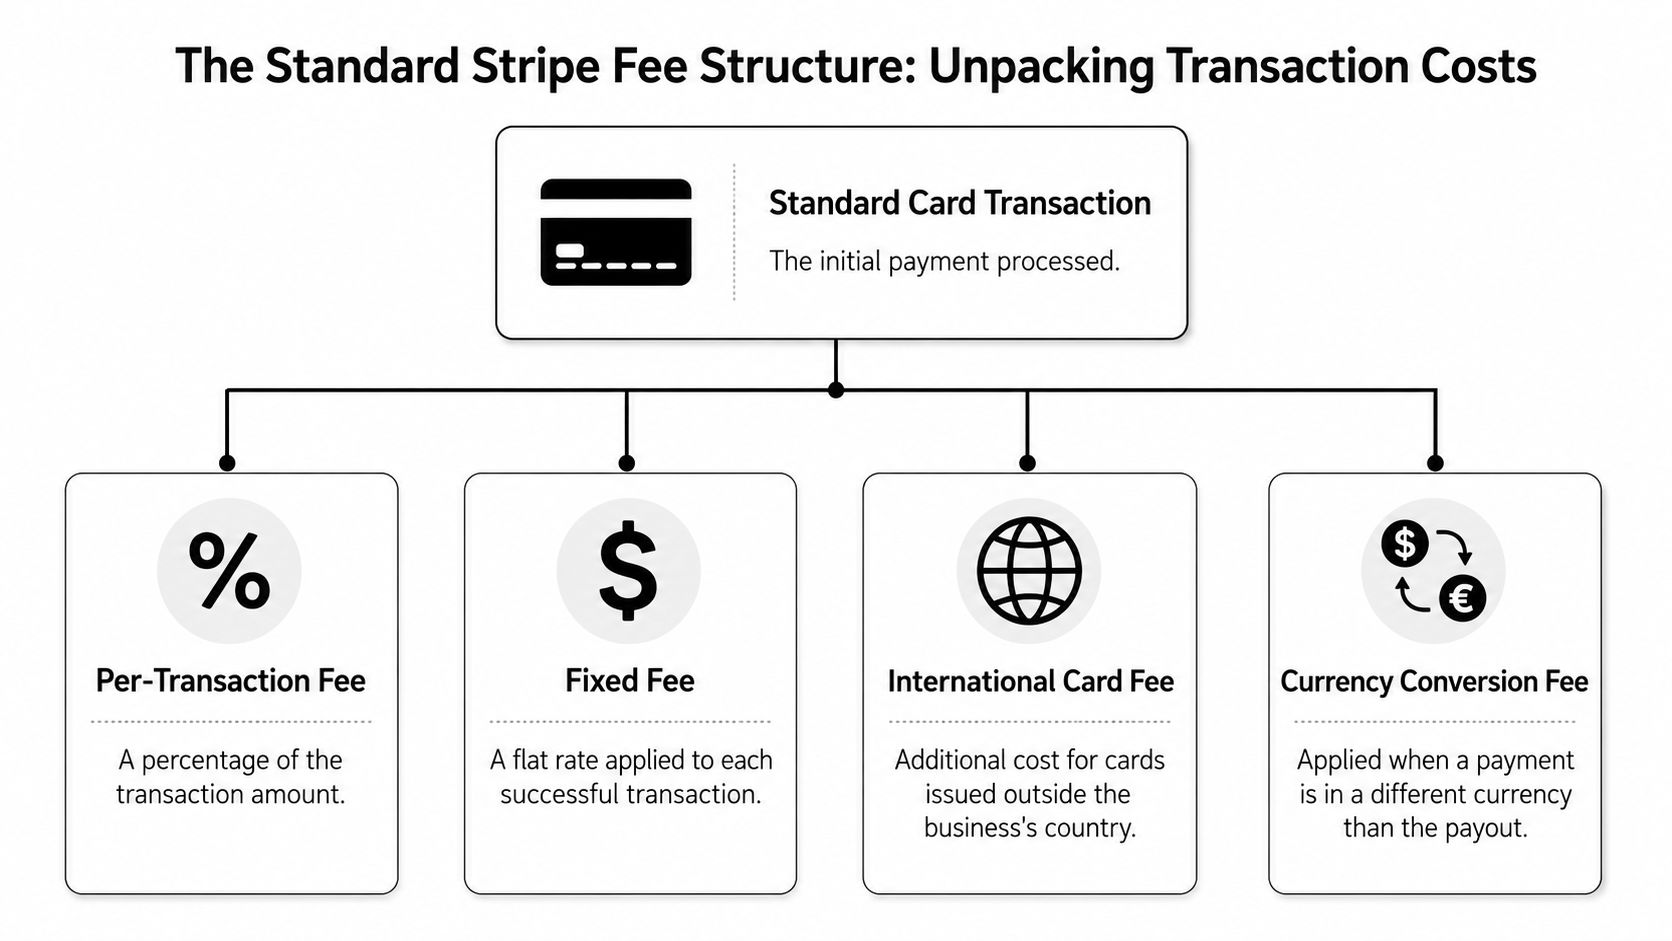
For a standard domestic online card payment, Stripe uses a simple pay-as-you-go model built around two charges: a percentage of the transaction and a fixed amount per successful payment. Independent summaries commonly describe that base online card fee as 2.9% + $0.30 per transaction.
That pricing gained traction for a reason. It is easy to model, easy to explain to a finance lead, and easy to plug into a first-pass unit economics sheet. If you run a domestic ecommerce store with a straightforward checkout flow, it gives you a clean starting point.
The structure itself is simple:
Percentage fee: a share of the transaction amount
Fixed fee: a flat charge applied to each successful payment
A simple example
On a $100 online card payment, the standard fee works out to $3.20. Your net deposit is $96.80 before any other adjustments.
Here is the baseline:
Transaction amount | Standard fee | Net before other adjustments |
|---|---|---|
$100 | $3.20 | $96.80 |
Practical rule: treat the standard rate as your floor, not your all-in processing cost.
That distinction matters. The advertised rate helps with rough planning, but operators get into trouble when they build pricing, CAC payback, or subscription margins around that number alone.
The base fee tells you the cost of a plain domestic card transaction. It does not capture the added costs that show up once the business grows into international sales, multi-currency billing, disputes, or extra Stripe products. For a global company, that gap between the published rate and the effective rate is often the whole story.
I usually tell founders to separate these into two buckets. First, the visible fee they see on the pricing page. Second, the effective fee that shows up in the P&L after cross-border charges, conversion costs, and payment operations overhead. The second number is the one that determines whether a market is profitable.
Stripe still works well for many businesses. The mistake is assuming the base card rate is the final cost. For global merchants, it rarely is.
International and Currency Conversion Fees
Domestic pricing is the easy part. A substantial increase in cost generally occurs when your customer is in another country, pays with an international card, or pays in a currency different from the one you settle in.
Independent guides cite an additional 1.5% fee for international card transactions and a 1% currency-conversion fee on top of the base card charge. One guide calculates that a $100 international sale can produce $5.20 in total fees once the base fee and added cross-border and currency charges are included. That same guide also notes that Stripe fee data is available 96 hours after a fee affects the balance, which matters for reconciliation at scale (SwipeSum guide to Stripe fees).
Where the extra cost comes from
There are usually two separate issues in cross-border payments:
The card is international
The customer's card was issued outside your business's country.The transaction requires currency conversion
The payment currency and settlement currency don't match.
Those charges may look small in isolation. In practice, they stack on top of the standard processing fee. For businesses that sell subscriptions globally, that stack repeats every billing cycle.
If you've ever tried to compare processors, bank cards, and payout methods across countries, it helps to study a few foreign exchange examples outside Stripe too. This breakdown of Capitec currency conversion fees is useful because it shows how FX costs often hide inside broader payment workflows rather than appearing as one obvious line item.
A related issue is merchant behavior. Some businesses absorb those fees and accept lower margin. Others adjust prices by region, settle in a single currency, or look for ways to avoid currency conversion fees when the business model allows it. Creators comparing platforms run into the same layered math, which is clearer once you see what percent Patreon takes after its own processing and platform charges stack up.
A side by side example
Here's the clearest way to think about it.
Fee Component | Domestic Sale (USD) | International Sale (EUR to USD) |
|---|---|---|
Base card fee | 2.9% + $0.30 | 2.9% + $0.30 |
International card fee | None | 1.5% |
Currency conversion fee | None | 1% |
Total fee on a $100 sale | $3.20 | $5.20 |
The table explains why the advertised rate and your actual payout can feel disconnected. The base fee is still there. It's just no longer the complete number that matters.
Most teams don't have a Stripe fee problem. They have an effective-rate visibility problem.
The operational impact
For a domestic sale, the math is predictable. For international sales, your margin becomes more sensitive to geography, payout currency, and customer mix.
That hits a few business models especially hard:
SaaS subscriptions: The same customer may generate this higher cost repeatedly over time.
Digital goods sellers: Margins can be thin, so extra payment cost changes contribution profit quickly.
Agencies and service businesses: Cross-border invoices may look profitable until payout economics are fully modeled.
The practical takeaway is simple. If your business is global, you shouldn't track only headline pricing. You should track the effective cost of acceptance by customer segment, currency, and region.
Other Stripe Fees You Need to Know
A lot of merchants think Stripe fees are mostly about card processing. That's only partly true. Once a business starts using more of the platform, the cost picture gets wider.
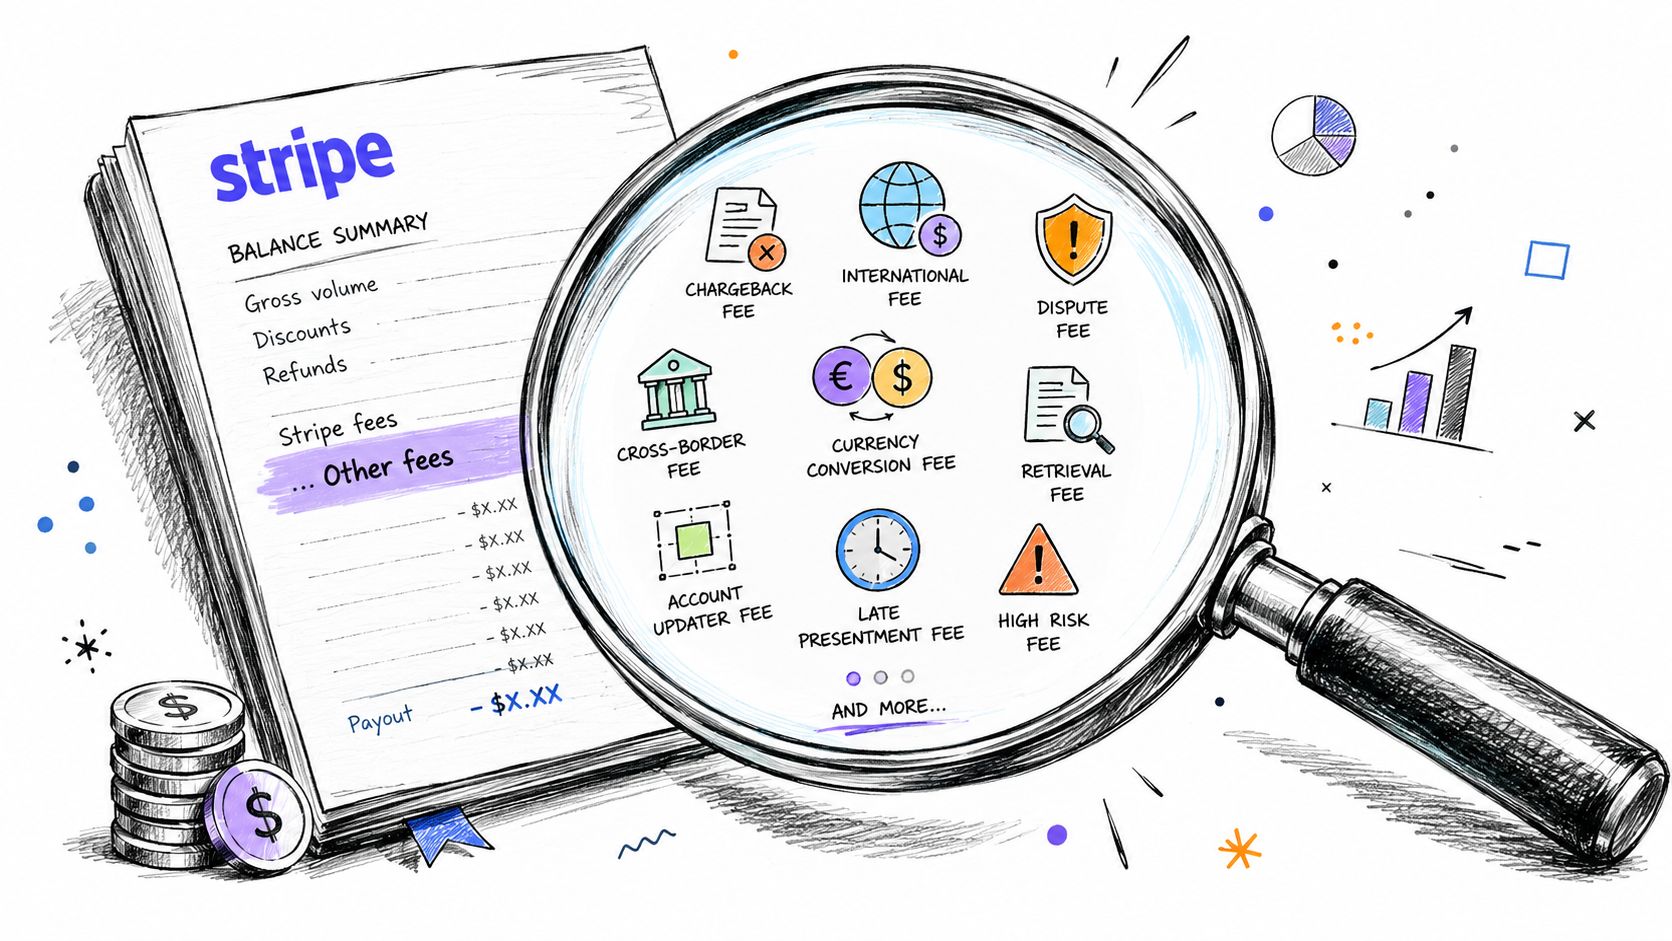
One analysis found that 75% of total Stripe fees came from payment processing and about 20% from monthly feature subscription fees, with Tax, Billing, and Radar highlighted as major contributors to total cost (Hyperswitch on Stripe fees). That's a useful reminder that the dashboard line called “fees” can include more than one kind of expense.
The fee categories that catch teams off guard
Some costs show up only in certain workflows. That's why they often surprise founders.
ACH and alternative rails: Stripe may apply separate charges depending on the payment rail or service used.
Disputes: A business dealing with chargebacks needs to treat them as both a support problem and a cost problem.
Payout-related charges: Depending on setup and product use, payout behavior can affect your accounting and treasury operations.
Refund handling: Even when customer service makes a refund the right decision, the economics may not fully reset the way new merchants assume.
These aren't “hidden” in the sense of being secret. They're disclosed. But they are easy to underestimate when you build a forecast from only the standard card rate.
A payment stack gets expensive in two ways. First through the obvious transaction fee, then through every operational feature that feels small on its own.
Why attached products matter
Many subscription businesses often misread their own numbers. They focus on the checkout fee and ignore the software layer attached to it.
If you use recurring billing features, fraud tooling, tax tooling, or other account-level products, your effective cost can drift higher even if your transaction mix stays the same. That doesn't mean those products are bad value. In many cases they save time or reduce risk. It does mean you should classify them correctly.
A useful internal reporting split is:
Cost bucket | What to include |
|---|---|
Pure payment acceptance | Card fees, international surcharges, currency-related charges |
Revenue operations tooling | Billing, tax, fraud, and related product subscriptions |
Risk and support leakage | Disputes, refunds, manual review time, failed collections |
That view changes the management question. Instead of asking only “What does Stripe charge per card payment?”, ask “Which parts of our stack are pushing up our blended cost, and which of them improve margin or save labor?”
For many teams, that's the first moment the fee conversation becomes useful.
How to Calculate and Reduce Your Stripe Fees
If you don't know your effective rate, you can't make good pricing decisions. The headline fee is marketing. Your effective rate is finance.
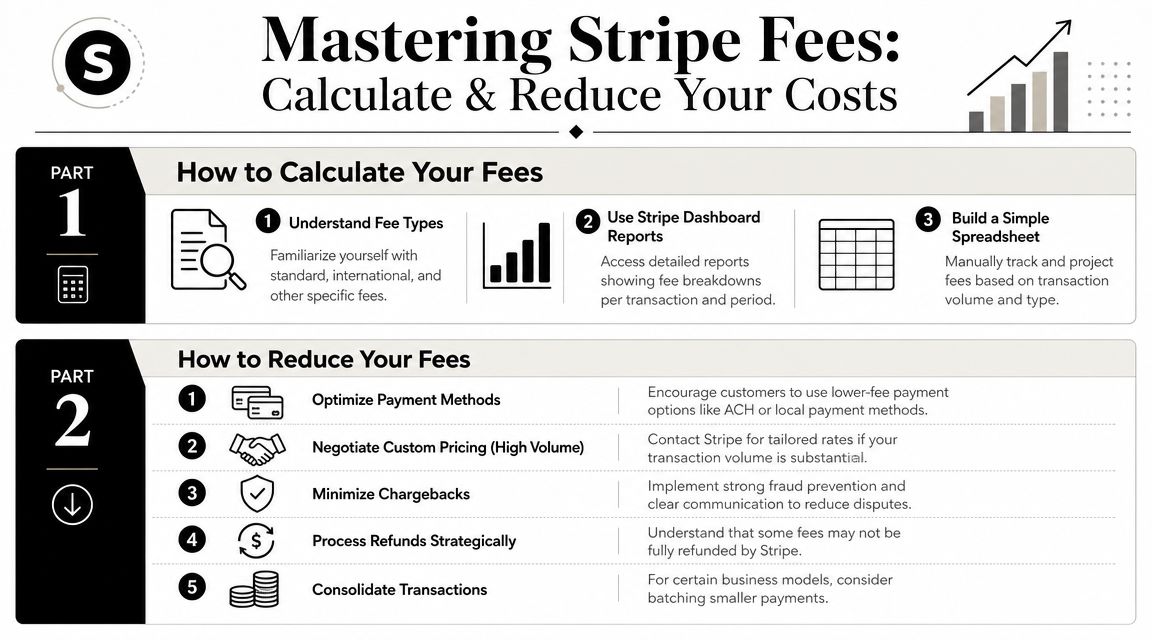
Stripe calculates processing cost on the transaction amount plus a fixed fee, and the platform may also apply separate charges for ACH, disputes, and related services. The practical implication is that the advertised card rate is not a complete all-in cost model, and fee modeling matters if you want accurate forecasting (Orb on Stripe pricing).
How to calculate your effective rate
Start with your reporting period. A month is usually enough to spot the pattern, though a quarter may smooth out noise if volume is uneven.
Then pull three buckets from your payment reporting and internal books:
Gross payment volume: Total processed sales.
Total payment-related fees: Card fees, international surcharges, currency-related fees, dispute-related charges, and other relevant payment costs.
Product-specific costs: Billing, tax, fraud, or other payment-stack subscriptions.
A simple working formula is:
Effective rate = total payment-related cost / total processed volume
That won't answer every accounting question, but it does answer the operational one. What does it cost you to accept revenue?
If you want a broader benchmark for evaluating processors and fee design, this guide to payment gateway pricing is a useful framing tool because it pushes you to compare total economics, not just the first visible percentage.
Here's a practical workflow many finance and ops teams use:
Export by transaction type: Separate domestic card volume from international and non-card flows.
Tag by customer geography: Region often explains fee variance faster than product category.
Compare periods: Look for changes after expanding into new countries, currencies, or subscription plans.
Before you optimize, it helps to review some general practical tips to avoid transaction fees. Not every tip will apply to online merchants, but the framework is useful because it forces you to ask which fees are avoidable and which are structural.
A short walkthrough can help if you want to see fee analysis from another angle:
Ways to reduce payment cost pressure
Not every fee can be reduced, but many can be managed.
Push lower-cost methods where appropriate: For some invoice or account-based flows, ACH or local methods may be worth evaluating.
Review your international mix: If a large share of revenue is cross-border, regional pricing and settlement strategy matter more than shaving a small amount off domestic volume.
Negotiate when your volume justifies it: Custom pricing discussions are often more productive when you bring a clear breakdown of transaction mix, average ticket size, and cross-border exposure.
Audit attached products: Keep the tools that reduce fraud, support, or churn. Question the ones that don't change outcomes.
Reduce dispute exposure: Cleaner descriptors, better support, and stronger billing communication often improve fee efficiency indirectly.
Teams often save money when they stop treating fees as a fixed tax and start treating them as an input they can model.
An Alternative for Global Businesses Card Payments with USDC Payouts
The headline card rate stops being the primary consideration once your business sells across borders. The bigger question is what ultimately arrives after settlement, conversion, and payout friction.
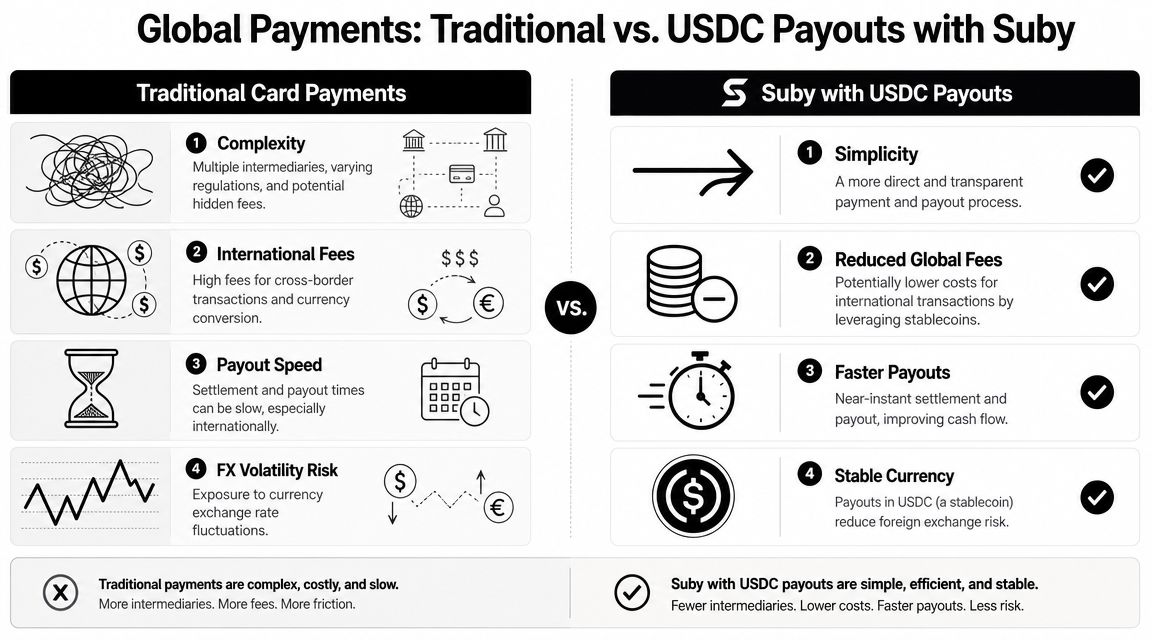
For some global merchants, the answer is to separate payment acceptance from payout. Customers still pay with familiar methods, but the business settles in USDC instead of waiting on traditional bank rails and absorbing every cross-border mismatch.
Why some global merchants change the payout model
This model is usually worth examining when revenue is international, delivery is digital, and finance teams care as much about settlement predictability as checkout conversion.
The practical shift is simple. The customer payment method and the merchant payout method do not have to be the same.
That matters because many of the cost surprises in global payments show up after the charge is approved. A business may accept a card payment smoothly, then lose margin through currency conversion, cross-border settlement friction, payout timing, or bank transfer overhead. Settling in USDC can reduce part of that operational drag, especially for companies already working with digital asset treasury, contractors, or global supplier payments.
What that looks like in practice
Suby is one example of this structure. It offers an API for businesses that want to accept card or crypto payments while receiving payouts in USDC. It also includes native integrations with Discord and Telegram for models like subscriptions, paid communities, and gated digital access. The published starting price is 2.9% + $0.30, positioned as all-inclusive on Suby pricing.
That price can be higher than a domestic card processor on paper. For a local business with same-country customers, same-currency sales, and ordinary bank payouts, it may not make sense.
For businesses with international volume, the comparison is different. The relevant benchmark is not the advertised card rate. It is the effective cost of getting paid across borders and receiving usable funds in a form the business can deploy quickly.
A setup like this can appeal when a company wants:
Card acceptance for customers
USDC payouts for the business
Less exposure to bank-country and settlement-country mismatch
More predictable cross-border treasury flows
This approach does not remove cost analysis. It changes where the friction sits, and for some global merchants, that shift is worth more than a lower advertised processing rate.
Frequently Asked Questions About Payment Fees
Are Stripe fees actually hidden
Usually, no. The problem is less about hidden pricing and more about incomplete reading. Merchants often remember the standard card rate and miss the operational charges that appear only in certain payment flows, currencies, or product setups.
Why is my payout lower than my sales total
Because sales total and payout total are different accounting events. Fees, refunds, disputes, reserve behavior, and payout timing all sit between a successful charge and the amount that finally lands.
When should I look at effective rate instead of the headline fee
As soon as you have international customers, subscriptions, multiple currencies, or add-on products. At that point, the headline rate stops being a reliable planning number.
Is a card processor always the cheapest option for global revenue
Not necessarily. It depends on where customers are located, how they pay, what currency you settle in, and how much operational friction your team absorbs after checkout.
What's the practical difference between acceptance and payout
Acceptance is how the customer pays. Payout is how your business receives funds. Many merchants focus only on checkout conversion, but payout structure often decides how predictable your cash flow really is.
Suby is a payment gateway and payment processor. Your customers pay with card, bank transfer, Apple Pay, Google Pay, Klarna, and more, or stablecoins, and you get paid out to your bank account, or directly in stablecoins (USDC, EURC) to your wallet, anywhere in the world, no bank account required. When the real cost of Stripe fees is cross-border settlement rather than the headline card rate, Suby separates how customers pay from how you get paid, with native Discord and Telegram integrations for subscriptions and paid access.
