
Every SaaS founder knows the thrill of signing up a new customer. But what about the ones quietly slipping out the back door? That's churn, and it’s one of the most destructive, silent killers of growth in the subscription world.
What Is SaaS Churn and Why Does It Matter
The "leaky bucket" is a classic analogy for a reason: it's brutally accurate. You’re constantly pouring your time, money, and energy into acquiring new customers, which is like filling the bucket. But if you have holes, you’re losing customers just as fast, or even faster, than you can bring them in.
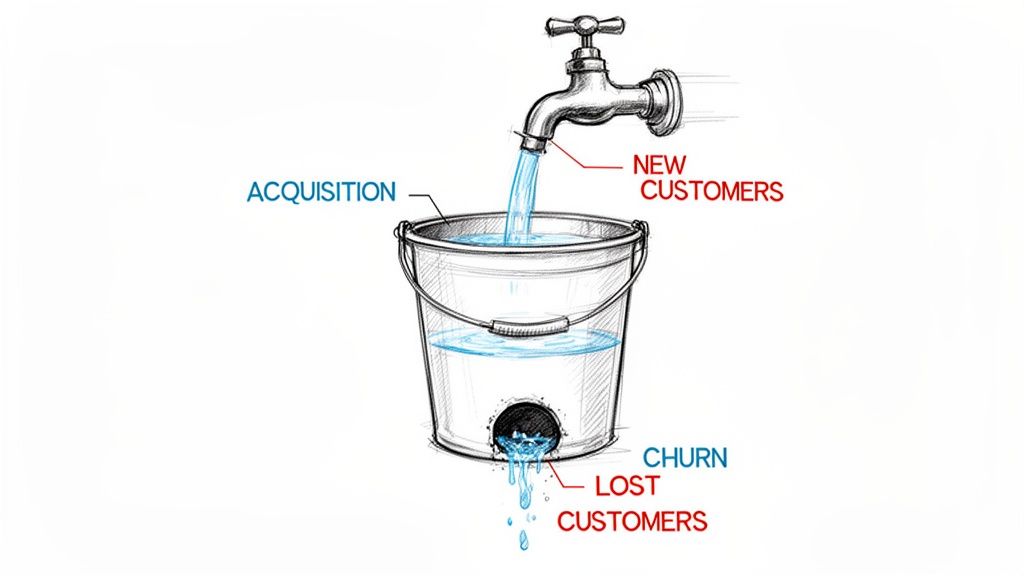
This puts you on a growth treadmill. You’re running hard just to stay in the same place, constantly backfilling your roster instead of building on a solid base. True, sustainable growth only happens when you keep more customers than you lose.
The Two Sides of the Churn Coin
Now, not all churn is created equal. To really understand what’s happening in your business, you need to look at it from two different angles. The Churn Rate is your starting point, but the story gets deeper.
This table provides a clear, side-by-side comparison of the two fundamental types of churn, helping you quickly grasp the key differences and what each metric reveals about your business.
Customer Churn vs Revenue Churn at a Glance
| Metric | Customer Churn (Logo Churn) | Revenue Churn (MRR Churn) |
|---|---|---|
| What It Measures | The percentage of customers who cancel their subscriptions. | The percentage of revenue lost from existing customers. |
| Calculation Focus | A simple headcount of lost logos. | The financial impact of cancellations and downgrades. |
| Key Question It Answers | "How many customers did we lose?" | "How much monthly revenue did we lose?" |
| What It Signals | Potential issues with broad user satisfaction, onboarding, or product-market fit for a segment. | Potential issues with high-value accounts, pricing, or the perceived value of premium tiers. |
Think about it: you could have low customer churn but cripplingly high revenue churn if your biggest enterprise clients are the ones leaving. On the flip side, high customer churn with low revenue churn might mean you're just losing smaller, free-tier, or less-engaged users, which is a very different problem to solve. You absolutely need to track both.
Why Churn Is a Non-Negotiable Metric to Track
Ignoring your churn rate is like flying blind. It's not just a "nice-to-have" metric; it’s a direct indicator of your company's health. And right now, the vital signs aren't looking great across the industry.
In 2023, B2B SaaS churn rates hit their highest levels ever recorded, jumping a staggering 20.5% over the previous year. If you want to dig into the data, you can read the full analysis about these market trends. It’s a wake-up call.
A rising churn rate is your business's early warning system. It tells you something is broken, maybe a clunky onboarding flow, a poor product-market fit, unresponsive support, or a pricing model that no longer makes sense.
Often, the culprit is something as mundane but critical as payment friction. For a global SaaS, failed credit card payments are a huge, often hidden, source of involuntary churn. This is where a flexible payment solution can make a real difference. Our API allows any business to accept payments by card or crypto, while the business receives stable USDC. This removes a common point of failure and helps keep paying customers, paying.
How to Accurately Calculate Your Churn Rate
Talking about churn is one thing, but getting your hands dirty with the actual numbers is where you gain real control over your business. Calculating churn doesn't have to be a headache, but it absolutely needs to be precise. Let's walk through the essential formulas every SaaS founder needs to know.
We'll start with the most basic metric: customer churn. Think of this as a simple headcount of how many customers you lost. It's your baseline for understanding retention.
Calculating Customer Churn
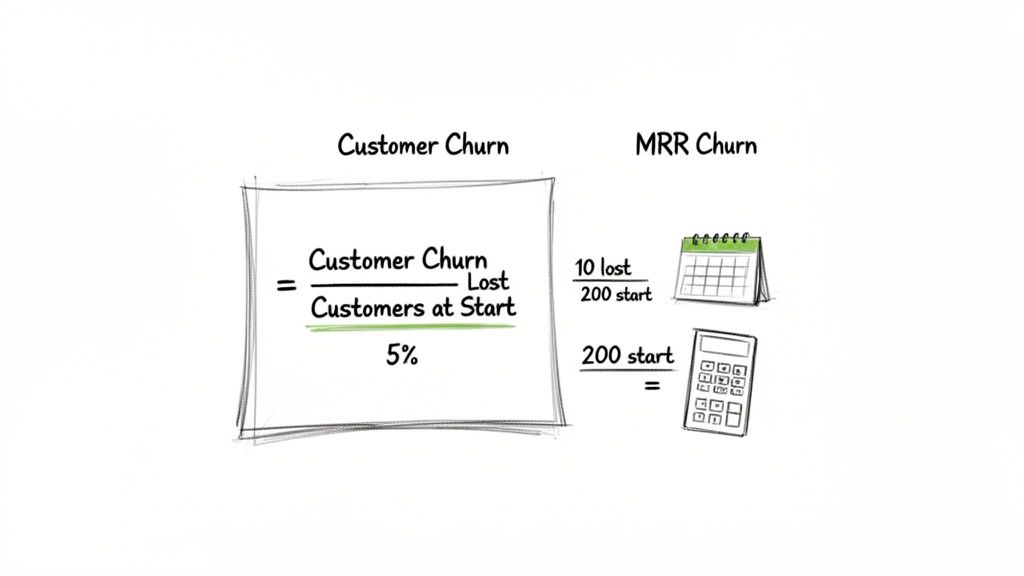
To get your customer churn rate, you just divide the number of customers who left during a period by the number you had when the period started.
Customer Churn Rate = (Number of Customers Who Left / Number of Customers at Start of Period) x 100
Let's make this real. Imagine you run a SaaS company that began January with 1,000 paying customers. Over the course of the month, 50 of them canceled.
- Customers Lost: 50
- Customers at Start: 1,000
- Calculation: (50 / 1,000) x 100 = 5%
So, your customer churn rate for January is 5%. This tells you that one out of every twenty customers walked away that month. It's a critical number, but it doesn't reveal the financial story behind those departures.
Measuring Revenue Churn for the Full Picture
This is where things get interesting. Revenue churn, also known as Monthly Recurring Revenue (MRR) churn, shows you the actual financial damage. It's arguably the more important metric because, let's be honest, losing five small-fry customers feels very different from losing one massive enterprise client.
To see the complete picture, we need to look at both Gross and Net MRR Churn.
Gross MRR Churn is a pure look at the revenue you've lost. It adds up all the MRR from cancellations and downgrades in a given period, completely ignoring any expansion revenue from existing customers.
Here's the formula:
Gross MRR Churn Rate = (MRR Lost from Cancellations & Downgrades / MRR at Start of Period) x 100
Now, let's look at Net MRR Churn, which provides a much more nuanced view of your business's health.
Net MRR Churn takes into account the revenue you gained from existing customers who upgraded or added new seats. This gives you a net perspective on revenue momentum within your current customer base.
The formula for Net MRR Churn looks like this:
Net MRR Churn Rate = ([MRR Lost] – [MRR Gained from Expansions]) / MRR at Start of Period) x 100
Let’s run the numbers again. Say your business started the month with $100,000 in MRR.
- You lost $7,000 in MRR from cancellations.
- But you gained $9,000 in MRR from existing customers upgrading their plans.
Your Net MRR Churn calculation would be:
($7,000 - $9,000) / $100,000 = -2%
That -2% is what we call negative churn. It's the holy grail for SaaS companies. It means your revenue from existing customers is growing faster than it's shrinking, and you're actually making more money from your current base than you're losing. This is an incredibly powerful engine for growth.
Achieving this is also where a frictionless payment system becomes critical, as it has to support both retention and easy upgrades. For example, a platform like Suby lets businesses accept global card payments that settle in USDC, which simplifies how customers can stay subscribed and expand their plans without hitting payment roadblocks.
So, What’s a “Good” Churn Rate, Anyway?
You’ve run the numbers. You have your churn rate. Now you’re staring at it, asking the million-dollar question: "Is this good or bad?"
The truth is, there’s no magic number. A “good” churn rate isn’t a universal figure you can pull from a textbook. It’s a reflection of your specific business, who you sell to, what your product does, and how mature your company is. What’s perfectly healthy for one SaaS company would be a code-red emergency for another.
It All Comes Down to Who You Serve
The most significant factor shaping your churn benchmark is your customer profile. The expectations for retaining a small business are vastly different from those for retaining a massive enterprise, and for good reason.
- Small and Medium Businesses (SMBs): SMB customers are a different breed. They have smaller budgets, operate on shorter (often monthly) contracts, and can switch tools with relative ease. Because of this, higher churn is just part of the game. A monthly churn rate between 3% and 7% is often considered normal, or even good, for a business focused on this segment.
- Enterprise Customers: Locking in an enterprise client is a major investment on both sides. They sign long-term deals, pour resources into implementation, and face enormous costs if they decide to switch. Losing one is a massive hit. Here, churn has to be incredibly low, ideally well under 1% per month.
A 4% monthly churn rate might be fantastic for a SaaS selling to startups, but it would spell disaster for a company catering to Fortune 500s. Context is king.
Industry Averages Are Your Reality Check
While your own context is what matters most, you can’t operate in a vacuum. Industry benchmarks are a crucial yardstick. They help you gauge whether your performance is in the normal range or if you’re sitting on a serious retention problem that needs immediate attention.
Looking at the data, the divide is clear. Studies consistently show that enterprise-focused SaaS companies can achieve impressively low monthly churn, often below 1.5%. This is a world away from the SMB space, where monthly churn can range from 4.8% to 8.1%. Across the entire B2B SaaS landscape, the average monthly churn hovers around 3.5%, a figure that includes both customers who actively cancel and those who slip away due to things like failed payments. If you want to dig deeper into the numbers, you can find a solid breakdown of average churn rates by industry.
Here’s the bottom line: Your churn benchmark is dictated by your customer. Stop chasing a mythical, one-size-fits-all number and start setting goals that make sense for the market you’re actually in.
The Real Pro Metric: Going Beyond Customer Churn with NRR
As you get more sophisticated, you’ll realize that just counting lost customers isn't enough. The most successful SaaS companies are obsessed with a more powerful metric: Net Revenue Retention (NRR).
NRR answers a simple but profound question: How much revenue did you keep from the same group of customers you had one year ago? It brilliantly balances the revenue you lost from churn against the new revenue you gained from expansions, upgrades, and add-ons from those same customers.
Top-tier public SaaS companies often boast NRR figures well over 100%, with the absolute best-in-class hitting 120% or more. Think about that. An NRR above 100% means your existing customer base is generating more revenue for you year after year, even after accounting for churn. It's the ultimate sign of a sticky product and a healthy business that grows with its users, not just by acquiring new ones.
Getting to that level requires a product and payments experience that makes it incredibly easy for customers to expand. For a global SaaS, that means eliminating cross-border payment friction. A unified payment layer which accepts cards from anywhere and settles in USDC, removes those barriers. It helps you keep customers and makes it dead simple for them to upgrade, a direct driver of a stronger NRR.
Finding the Real Reasons Customers Leave
Okay, so you’ve got your churn rate calculated and you know how you stack up against the benchmarks. Now for the hard part: playing detective. Knowing that you're losing customers is one thing; figuring out why is how you actually start plugging the leaks. This is where we move past just watching the numbers and start diagnosing the real problem.
The single most powerful tool for this job is cohort analysis. Think of it like a series of class photos for your customers. A cohort is just a group of people who all signed up around the same time, for example, everyone who joined in January is one cohort.
By tracking these groups over their lifetime, you can see how their behavior changes. Imagine you discover that customers who joined in March are churning at twice the rate of those from January. That’s a massive clue. It tells you something went wrong around that time. Maybe a new feature rollout was a dud, or a change to the onboarding flow left people confused.
Spotting Trends with Cohort Analysis
Without cohort analysis, you're just looking at a single, blended churn rate for everyone, which hides all the interesting details. By isolating specific groups, you can ask much sharper questions and get real answers.
Here’s a typical cohort analysis table. It tracks what percentage of customers from each monthly cohort are still active in the months following their signup.
A chart like this tells a story. Look closely. If you see the "Month 1" retention number start to dip for newer cohorts, that’s a flashing red light. It’s a strong signal that your onboarding or initial user experience is getting worse, not better.
What Your Cohorts Are Trying to Tell You
Once you start spotting these trends, you can connect them to the specific reasons customers are leaving. While every SaaS is unique, the root causes usually fall into a handful of familiar buckets.
- A Rough Start (Onboarding): The first few minutes or hours with your product are make-or-break. If new users can't find that "aha!" moment and see the value quickly, they're gone.
- The Wrong Fit (Product-Market Mismatch): You might be attracting the wrong audience for your product, or your product might not quite solve the problem your ideal audience has. Either way, it's a mismatch that leads straight to churn.
- Bad Support Experiences: When someone hits a snag and can't get a quick, helpful answer from your team, their trust erodes. A single frustrating support ticket can be the final straw.
- The Price Isn't Right (Value Perception): If customers don't feel the value they're getting is worth the price they're paying, they'll start shopping for alternatives. It's a simple cost-benefit calculation.
- Accidental Churn (Failed Payments): This one is the silent killer. A huge number of customers don't churn on purpose. They're lost because a payment fails, and the subscription gets canceled automatically.
The Hidden Drain of Failed Payments
Let’s zero in on that last point, because it's one of the biggest, and most fixable, sources of lost revenue. Involuntary churn is what happens when a subscription is canceled because of a technical payment issue, not a customer decision. This is usually due to an expired card, insufficient funds, or an overzealous bank flagging a legitimate transaction.
The customer never decided to leave you; their payment method just failed. For any business built on recurring revenue, this is a five-alarm fire. You can get ahead of this by rethinking your entire approach to managing SaaS subscriptions.
Involuntary churn is often the "low-hanging fruit" of churn reduction. These are customers who want to keep paying you, but your payment system is getting in the way.
Fixing this isn't about sales or marketing. It's about removing a dumb, unnecessary roadblock. This is where a robust payment infrastructure becomes your best friend. For example, our API provides a global payment layer that drastically simplifies transactions. By letting your customers pay with their card while your business receives stable USDC, you cut through the cross-border friction and bank declines that cause so many payments to fail. It's a straightforward change that can have a direct and immediate impact on lowering your involuntary churn.
Your Playbook for Actively Reducing Churn
Alright, you've done the hard work of digging into your data and diagnosing why customers are leaving. Now for the important part: moving from analysis to action.
Tackling churn isn't about finding one secret fix. It's about building a robust system with both proactive and reactive strategies. You need to play defense to keep customers from ever wanting to leave, and you need a solid offense to win back those who are heading for the door.
Think of it as a continuous loop. You spot a problem with cohort analysis, dig in to find the root cause, and then ship a fix. This isn't a one-and-done project; it's a process.

By constantly running this playbook, you create a cycle of improvement that stops churn from spiraling out of control.
Proactive Strategies: Get Ahead of the Problem
Honestly, the best way to fight churn is to prevent it from happening in the first place. These strategies are all about creating an experience so valuable and seamless that leaving never even crosses your customer's mind.
It all starts with onboarding. Your customer’s first few interactions with your product are make-or-break. If they’re confused or can't see the value right away, they’re gone. Your single most important goal is to guide them to that "aha!" moment, the point where your product’s value clicks, as quickly as humanly possible.
From there, you need to keep a finger on the pulse of your customer base by monitoring their customer health. This isn't about spying; it's about watching for behaviors that signal a customer is either deeply engaged or drifting away.
- Product Usage: Are they logging in? Using the features that make your product sticky? A sudden drop in activity is a five-alarm fire.
- Support Tickets: A flood of tickets might mean they’re frustrated. But a total lack of contact can be just as bad, as it might mean they’ve already given up.
- Feature Adoption: When you release new features, are they trying them? Customers who explore new functionality are invested in growing with you.
Reactive Strategies: Winning Back At-Risk Customers
Look, even with the world's best product, some customers will inevitably churn. Reactive strategies are your game plan for these critical moments, helping you understand why they're leaving and, hopefully, giving you a shot at saving them.
The classic tool here is the exit survey. When someone hits that "cancel" button, don't just wave goodbye. Ask them a simple question: "Why are you leaving?" A multiple-choice list with an optional text box is all you need. The feedback you’ll get is pure gold for your product roadmap.
But there's another, often overlooked, type of churn you need a plan for: involuntary churn. This is when a customer is lost because of a billing issue, not because they actually wanted to leave. These are your most recoverable customers, and fixing this is low-hanging fruit.
A huge chunk of your churn might be completely accidental. These customers didn't choose to leave; their payment just failed. Fixing this is one of the fastest ways to improve your retention numbers.
This is where a smart dunning process becomes non-negotiable. You need an automated way to notify customers about failed payments and remind them about expiring cards. We cover how to set this up in our guide on the dunning process.
The Unsung Hero of Retention: Frictionless Payments
All these strategies, proactive and reactive, fall apart if your payment system is a mess. What's the point of building an amazing product if a customer who wants to pay you simply can't?
For global SaaS companies, this is a massive headache. Cross-border payments often fail for reasons that have nothing to do with the customer's intent or account balance. One failed payment can undo months of hard work building a great relationship.
This is where your payment solution stops being a simple utility and becomes a core part of your retention strategy. For instance, we provide a global payment layer designed to solve this exact problem. We let businesses accept card payments from anywhere and receive funds in stable USDC. That one change eliminates a huge amount of friction at the point of sale.
By integrating a flexible payment system, whether through a simple API or native integrations for platforms like Discord and Telegram, you make it ridiculously easy for users to pay and stay subscribed. Fewer random declines from international banks means less involuntary churn. A smoother checkout means a better customer experience. It makes your whole product stickier.
At the end of the day, retention is the engine of growth. Industry data is clear: companies with a Net Revenue Retention (NRR) over 100% grow 43.6% annually, while those below 60% are basically dead in the water. (You can dig into more SaaS customer retention benchmarks to see for yourself). A seamless payment flow is a direct lever you can pull to strengthen your NRR, turning what was once a liability into a powerful tool for growth.
How to Measure Your Churn Reduction Efforts
So, you’ve put a plan in place to fight churn. Great. But how do you know if it's actually working?
Trying to reduce churn without measuring your progress is like flying a plane blind. You might be pulling levers and pushing buttons, but you have no idea if you're gaining altitude or heading for a nosedive. To make any real headway, you need a tight feedback loop connecting your actions to tangible results.
This all starts with tracking the right numbers. The best way to do this is by creating a simple, real-time dashboard that keeps these vital signs front and center. You need to monitor the essential customer retention metrics that tell the true story of your business's health.
Don't overcomplicate it. A good dashboard gives you an at-a-glance view of what matters most.
Key Metrics for Your Churn Dashboard
Your dashboard should be focused on a handful of core metrics that paint a clear picture of your customer and revenue health. I'd consider these the absolute must-haves:
- Customer Churn Rate: The classic headcount. This percentage shows how many customers walked away in a given period. It's your highest-level indicator of customer happiness (or unhappiness).
- MRR Churn Rate (Gross and Net): This is the financial pulse of your business. Gross MRR churn shows the total revenue you lost from cancellations and downgrades, while Net MRR churn factors in expansion revenue from upgrades, giving you a truer sense of momentum.
- Cohort Retention Curves: Think of this as your diagnostic tool. By grouping customers by their signup month, you can see if the changes you're making are actually improving how long new users stick around.
- Payment Failure Rate: A critical, and often overlooked, metric for involuntary churn. If this number is dropping, it means your dunning, payment retries, and other recovery efforts are paying off.
Once you have these metrics displayed clearly, you can start asking much smarter questions. You move from a vague "Is churn getting better?" to a specific, data-driven query like, "Show me the churn rate for the January 2026 cohort versus the April 2026 cohort." That’s where you find the real answers.
A real-time dashboard transforms churn from a scary, abstract number into a tangible problem you can actively solve. It gives you the immediate feedback needed to see if your experiments are working, allowing you to double down on what’s effective and cut what isn’t.
This is exactly where a modern payment solution with built-in analytics becomes a game-changer. A platform like Suby, for example, gives you this real-time dashboard right out of the box, offering instant visibility into payments, active subscriptions, and churn. Because it’s the system actually processing the transactions, the data is always clean and up-to-the-minute. When a customer pays by card and you receive USDC, that event is reflected instantly. No lag, no guesswork, just a live view of your revenue health.
For agencies, freelancers, and developers who rely on recurring revenue, keeping a high Gross Revenue Retention (GRR) is paramount. You can drive this with API-integrated subscriptions and a real-time churn dashboard, along with features that encourage customers to stay and expand their accounts.
Ultimately, measuring your efforts is what separates wishing for lower churn from actually achieving it. By setting up a clear dashboard and asking the right questions, you build a system for continuous improvement. If you're looking for the right tools to build this system, check out our guide on the best subscription billing software.
Frequently Asked Questions About SaaS Churn
Let's tackle some of the most common questions that come up about churn. I've heard these from hundreds of founders, and getting the answers straight can really clarify your thinking.
What Is the Difference Between Voluntary and Involuntary Churn?
Think of it as a conscious choice versus a simple accident.
Voluntary churn is when a customer looks at your product and actively decides, "This isn't for me anymore." They click the cancel button on purpose. This might be because they found a competitor, their budget changed, or the product just wasn't the right fit.
Involuntary churn, on the other hand, is the silent killer. The customer didn't want to leave, but their payment failed. This happens all the time with expired cards, bank declines, or insufficient funds. It’s an accidental cancellation, and it's often the lowest-hanging fruit for churn reduction.
Can I Have Negative Churn?
Yes, and you absolutely should aim for it. This is the holy grail of a healthy SaaS business.
Negative churn happens when the revenue you gain from existing customers, through upgrades, cross-sells, or expansion, is greater than the revenue you lose from cancellations. When you hit this point, your business grows automatically, even if you don't sign a single new customer. It's a powerful signal that your product is essential and its value is compounding over time.
How Often Should I Calculate My Churn Rate?
As a rule of thumb, calculate your churn rate monthly. This cadence is frequent enough to spot trends and see if your efforts are moving the needle, but not so frequent that you're just reacting to daily noise.
If you're running a specific test, like a new dunning campaign, you might want to track results weekly to get faster feedback. The most important thing is consistency. Pick a timeframe and stick with it so you can make meaningful, apples-to-apples comparisons.
A common mistake is treating all churn as a product problem. Often, a significant portion is a payments problem. By streamlining the payment process, you can directly reduce involuntary churn and improve retention.
Many founders are surprised to learn how much of their "churn problem" is actually a "payment problem," especially when operating globally. Your checkout and payment experience is a core part of your product, not just an add-on.
This is why having a flexible payment infrastructure is non-negotiable. For example, Suby is a global payment layer for online businesses, combining card and crypto acceptance with fast, predictable USDC settlements. Merchants using Suby can create shareable paylinks, embed a checkout, or integrate via a simple API, with all revenue settled in USDC. Learn more about how a modern payment layer can help your business.
Suby provides a global payment layer that lets you accept card or crypto payments and receive revenue in USDC. Integrate in minutes with our API, or use our native tools for Discord and Telegram to manage subscriptions and grow your online community.